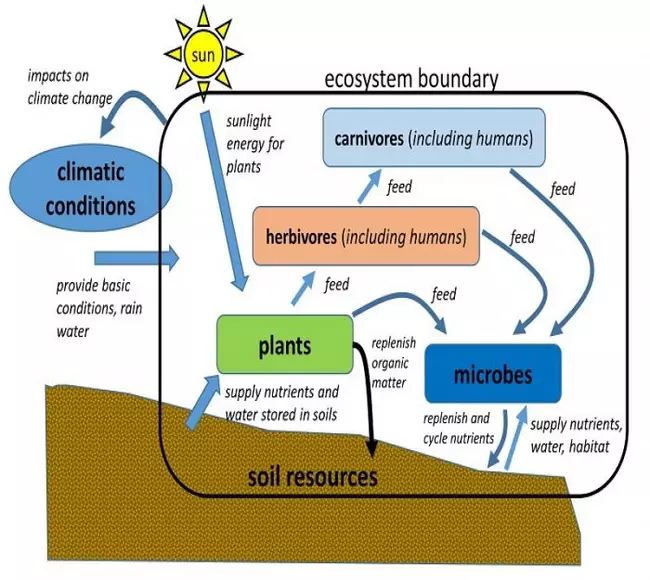


Fig. 1.2.1. A simplified diagram of a typical ecosystem. Ecosystems are a common system type analyzed by geoscientists, ecologists, and agroecologists. The black rectangular outline is one way to define a boundary for the ecosystem, where climate and sunlight fall outside the system but provide resources and define the conditions under which the ecosystem develops. This diagram can also be considered a type of concept map where for example 'sun', 'plants', and 'climate' are <em>components</em>, and the arrows connecting the components are <em>relationships </em>in the system. These relationships are now labeled as either flows (of energy, food, nutrients) or causal links, like the way that dead plants and animals end up feeding soil microbes, or the ecosystem affects the climate over time. You may be able to see how this simplified diagram could represent a far more complex system containing hundreds of plant and animal species and thousands of types of microbes, interacting in complex ways with each other and the environment. Keep this diagram in mind as a possible example when you think about completing your preliminary concept map of a regional food system at the end of unit 1.
Originally uploaded in Integrate:Teaching for Sustainability:InTeGrate Modules:Future of Food:Student Materials.
Image 173883 is a 625 by 700 pixel WebP
Uploaded:
Jan3 18