Stream Gaging Using the Velocity-Area Method
What is Stream Gaging?

Stream gaging is a technique used to measure the discharge, or the volume of water moving through a channel per unit time, of a stream. The height of water in the stream channel, known as a stage or gage height, can be used to determine the dischage in a stream. When used in conjunction with velocity and cross-sectional area measurements, stage height can be related to discharge for a stream. If a weir or flume (devices, generally made of concrete, located in a stream channel that have a constant, known shape and size) is used, mathematical equations based on the weir or flume shape can be used in conjunction with stage height, negating the need for velocity measurements.
How Are Steams Gaged?

As mentioned above, stream gaging can be done by measuring the stage height and velocity at a series of points in a cross-section of a stream or by constructing a flume or weir and recording stage height. Stage height can be measured using a ruler, or a pressure transducer or stilling well connected to a data logger. Stream gaging methods will be discussed in further detail below.
Measuring Stage and Velocity to Determine Discharge Via The Velocity-Area Method

Discharge, or the volume of water flowing in a stream over a set interval of time, can be determined with the equation:
Q = AV,
where Q is discharge (volume/unit time-e.g. m3/second, also called cumecs), A is the cross-sectional area of the stream (e.g. m2), and V is the average velocity (e.g. m/s).
Stream water velocity is typically measured using a current meter. Current meters generally consist of a propeller or a horizontal wheel with small, cone-shaped cups attached to it which fill with water and turn the wheel when placed in flowing water. The number of rotations of the propeller or wheel-cup mechanism corresponds with the velocity of the water flowing in the stream. Water flowing within a stream is subject to friction from both the stream bed and the air above the stream. Thus, when taking water velocity measurements, it is conventional to measure flow at 0.6 times the total depth, which typically represents the average flow velocity in the stream. This is achieved by attaching the current meter to a height-calibrated rod. The rod can also be used to measure stream stage height. If a current meter is not available, another technique known as the float method can be used to measure velocity. While less accurate, this method requires limited and easy to obtain equipment. To measure velocity via the float method, one simply measures the time it takes for a floating object (such as an orange peel) to travel a measured distance. Velocity is then calculated by dividing the distance traveled by the time it takes for it to travel that distance.
Velocity also varies within the cross-section of a stream, where stream banks are associated with greater friction, and hence slower moving water. Thus, it is necessary to take velocity measurements along a cross-section of a stream. Since stream channels are rarely straight, it is helpful to measure velocity across an "average" reach of the stream (e.g. average width and depth) with a single channel, a relatively flat stream bed with little vegetation and rocks, and few back-eddies that hinder current meter movement.
Discharge is measured by integrating the area and velocity of each point across the stream; that is, the stream is divided into sections based on where velocity and stage height measurements were taken in the cross-section of the stream. By multiplying the cross-sectional area (width of section x stage height) by the velocity, one can calculate the discharge for that section of stream. The discharge from each section can be added to determine the total discharge of water from the stream.
Discharge and stage height are often found to be empirically related and this relationship can be elucidated using a rating curve. A rating curve is constructed by graphing several manually derived discharge measurements (e.g. measured using method described above) with a corresponding stage height. A best-fit curve is fit to these data points and the equation of the line corresponds to the relationship between stage and discharge. The greater the number of measurements, the more reliable the rating curve will be to determine discharge based on stage data.
Measuring Discharge Using a Weir
Discharge in small streams can be conveniently measured using a weir. A weir is a small dam with a spillway, usually made of erosion-resistant material such as concrete, of a specific shape. Two common weir shapes are a 90° V-notch or a simple rectangular cutout. This method for measuring discharge involves creating a dam just downstream of the weir. This dam impounds in the weir, resulting in a more or less consistent stage height (e.g. a pool of more stagnant water without complications determining height due to waves or ripples). Using the height of water in the weir, one can determine discharge using one of the following empirically-derived equations:
Rectangular weir:
Q = 3.33 (L-0.2H)H3/2, for measurements in feet;
Q = 1.84 (L-0.2H)H2/3, for measurements in meters.
90° V-notch weir:
Q = 2.5H5/2, for measurements in feet;
Q = 1.379H5/2, for measurements in meters.
Q represents discharge (ft3/s or m3/s), L is the length of the weir crest (ft or m), and H is the height of the water in the backwaters/weir. As you can see, these equations negate the need for measuring point velocities and are generally more reliable since the concrete construction of the weir resists change in channel shape, which is a confounding factor when using the velocity-area method to determine discharge.
The Manning Equation
A simple equation, known as the Manning equation, can be used to estimate water velocity in an open channel. The Manning equation is:
V = 1.49R2/3S1/2/n, for measurements in feet
Or
V = R2/3S1/2/n, for measurements in meters,
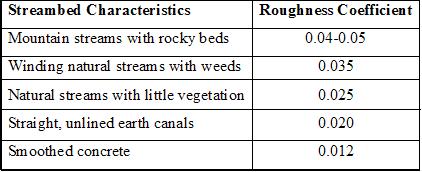
where V is the average velocity (ft/s or m/s), R is the hydraulic radius (the ratio of cross-sectional area of flow in ft2 or m2 to the wetted perimeter in ft or m-see diagram to define this factor), S is the energy gradient or slope of the water surface, and n is the Manning roughness coefficient (estimated based on published values, some of which are shown in the table below).
 (values from Fetter, 2001).
Results Analysis
Discharge measurements using the velocity-area method without the use of a weir provide a good estimate for stream flow and discharge. However, this method assumes several things, including a constant cross-sectional area (which is not always the case, as streams are erosive, dynamic systems), a strong relationship between stage height and discharge, and little human error in measuring velocity, stage height, and cross-sectional area. A weir provides a more reliable measurement due to consistency in channel cross-sectional area and depth, but equations associated with weir discharge measurements were empirically derived, and thus may also have error associated with them due to variability among stream systems. In any case, the greater the number of measurements to derive a ratings curve, the better since a greater range in measurements will be provided. Furthermore, keep in mind that ratings curve measurements may fit a number of lines/equations, depending on environmental factors such as times of snowmelt, where discharge may increase rapidly or times of drought when discharge may be immeasurable via this technique.
Literature
- Fetter, C.W. (2001). Applied Hydrogeology. 4th ed. New Jersey: Prentice Hall. 598 p.
- Weight, W.D. and Sonderegger, J.L. (2001). Manual of Applied Field Hydrology. New York: McGraw Hill Publishing Co. 608 p.
Related Links
- USGS Stream-Gaging Program- this page, hosted by the USGS, provides a detailed explanation of how stream gaging is done.
- USGS Discharge Measurements at Gaging Stations- this link provides an option to download a technical manual on how to obtain discharge measurements from gaging stations.
- USBR Water Measurements- this website provides information about acoustic flowmeters and transducers, including a description, calibration, strengths, limitations, and maintenance of each device.
Teaching Activities
- USGS- How streamflow is measured- this page, hosted by the USGS, provides a short summary about measuring streamflow, and can be used to provide students with a short overview of the process.
- Stream Gaging Lab- this laboratory exercise from the University of Colorado at Boulder, includes instructions and follow-up questions for measuring streamflow using the float method and the velocity-area method.
- USGS Real-time stream flow- this site, by the USGS, provides real time data for streamflow at monitoring stations across the United States. These data can be used to conduct a laboratory exercise without physically measuring streamflow (e.g. without necessity of equipment and traveling to a stream).
- Quantifying Groundwater Baseflow and Improving Math Skills through a Stream-Discharge Exercise- A two-part exercise, from the SERC Hydrogeology Workshop, is presented where students quantify stream discharge and use the data to determine groundwater baseflow. They first use tedious hand calculations to compute discharge; then develop their own spreadsheets to perform the calculations more efficiently and accurately. Finally, students collect field data and use their spreadsheets to determine discharge and to calculate some simple statistics.
- Discharge and Sediment Transport in the Field- In this quantitative field activity from the SERC Teaching Quantitative Skills in the Geosciences module, students collect field data on channel geometry, flow velocity, and bed materials. Using these data, they apply flow resistance equations (Manning and the depth slope product) and sediment transport relations (Shields curve) to estimate the bankfull discharge and to determine if the flow is sufficient to mobilize the bed. This activity requires students to utilize theoretical and empirical equations derived in class in the context of a field problem.One should allow for 2 hours in the field and assume an additional 2-4 hours of student work outside of class.