
Week 10: Exploring Precipitation Patterns
On this page
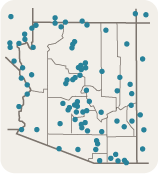
Using Google Earth to Visualize Rainfall Patterns in Arizona
Key investigation questions
- How does ground-based rain gauge data compare with satellite data?
- How much rain did Arizona get on November 26, 2008?
Scientists compare satellite measurements with ground-based rain gauge data to improve the accuracy of their forecasting models. Rainlog.org is a cooperative volunteer rainfall monitoring network for Arizona. Gauge data from Rainlog is used for a variety of applications, ranging from watershed management activities to drought planning at local, county, and state levels. Maps made from Rainlog volunteer data help scientists track high-resolution variability in precipitation patterns and potential changes in Arizona's drought status.
Arizona's precipitation is highly variable and greatly influenced by topography and the season of the year. Winter storms with heavy snows are common in the higher mountain elevations in northern and central parts of the state, while summer thunderstorms occur frequently in the mountain areas of central and southeastern Arizona. Heavy rainfall in Arizona tends to be very localized, as much of the state sees little or no precipitation for long stretches of time. The average annual precipitation for Arizona is just over 13 inches.
Use Google Earth to View Rain Gauge Data Mapped Alongside Satellite Data
- Launch the Giovanni TRMM Online Visualization and Analysis System in a new window.
- Select your Area of Interest, the state of Arizona, using the Click and Drag Selection tool or by setting the bounding coordinates to West: -115; North: 37.5; South: 31; East: -108.5.
- Choose precipitation as the data Parameter.
- Set the Temporal parameters: Begin Date: November 26, 2008, Hour: 00; End Date: November 26, 2008, Hour: 21
- Leave the visualization type as Lat-Lon map, Time-averaged and click the Generate Visualization button.
- Giovanni will generate a data set to view / download.
- Click on the Download Data tab at the top of the results page that opens.
- Scroll down to the bottom of the page. Under the Output Files heading, check the box next to the KMZ icon. Then click on the KMZ icon. The file will download to your computer and, depending on your settings, launch Google Earth.
- If it does not automatically open, launch Google Earth by double-clicking its icon on your computer's desktop or by clicking its icon in the Start menu or launch bar (Win) or the dock (Mac).
- Click File > Open, navigate to your Week 10 folder, select the KMZ file you downloaded from Giovanni, and click Open. The file will be added to the Temporary Places section of your Places panel.
- Go to the Rainlog.org website to acquire rain gauge data for Arizona on November 26, 2008.


