Sea Floor Spreading II
 This material was originally created for
Starting Point:Introductory Geology
 and is replicated here as part of the SERC Pedagogic Service.
Summary
In this Activity students import ocean bathymetry data from either the Topex web site (more info) or text files. Students then graph these observations along with model predictions to assess the model's ability to simulate the observed topographic features of the North Atlantic.
Brief overview of Ocean Depth/ Sea Floor Spreading Model
Activity I is the first part of this activity for students completely unfamiliar with Excel.
Learning Goals
- Use Excel to import and graph ocean bathymetery data.
- Use Excel to compare model predictions with observations.
- Use Excel to perform model sensitivity studies.
Context for Use
Description and Teaching Materials
We provide the following resources with this module:
- Activity Sheet (Acrobat (PDF) 1.2MB May23 03)
- Answers Document (Excel 824kB Apr3 04) with several sheets representing different levels of completion. These Excel documents can be used for the following purposes:
- Introducing concepts and ideas in interactive lectures.
- Making transperancies or Power Point slides.
- Checking student results.
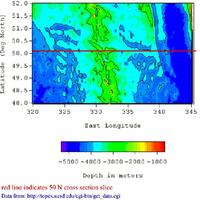
- Text files for North Atlantic depth cross-sections along 30deg N ( 28kB Apr3 04), 40deg N ( 47kB Apr3 04), and 50deg N ( 35kB Apr3 04) The data columns in these files are East Longitude, Latitude, and elevation in meters.
- Sample images of what is in the Excel Answer Document and what students are expected to accomplish. (see Figures 1 and 2 below).
Figure 1. Shows how well the model fits to observations for the cross-section of the North Atlantic along 50° N shown in the Figure 2 below.
Figure 2. The cross-section of the North Atlantic along 50° N used for the observations of Figure 1 above. This also shows the true complexity of ocean floor topography.
Teaching Notes and Tips
Assessment
Grading the completed activity sheet provided can be used as an assessment of student understanding. The future success of students on other Excel related activities is also another useful assessment tool.
A link to an Excel Answers Document is provided above with several sheets representing different levels of completion for this activity. This can help instructors:
- assess student success for this acivity;
- answer student questions that come up;
- quickly familiarize themselves with the activity.
References and Resources
- Brief overview of Ocean Depth/Sea Floor Spreading Model
- Sea Floor Spreading I is the first part of this activity for students completely unfamiliar with Excel.
- Resource for learning Excel
- Resources Graphing Tutorial: Graphing with Excel (more info) : Data input into cells, Creating a scatter plot and line graph. Advanced: Bar graphs and histograms, Importing text files, Final formatting, Regression lines, Superimposing graphs, Descriptive statistics, Selecting data for display


