Simulating a P-value for Testing a Correlation with Fathom
This material is replicated on a number of sites
as part of the
SERC Pedagogic Service Project
Summary
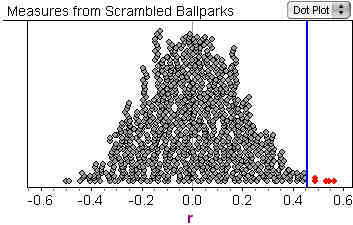
Students use simulation to test whether the capacity of major league baseball parks and average attendance at games have a positive association. After creating a plot and finding the correlation for a sample consisting of values for all teams in the 2006 season, students use the Fathom software package to scramble the capacities to see how the sample correlation behaves when there is no association between the variables.

Learning Goals
The main goal is to give students experience with seeing the p-value of a hypothesis test as the chance, when the null hypothesis is true, of seeing data as extreme (or more extreme) than the data observed in an original sample.
Context for Use
This activity is designed to help students understand the idea of a p-value within the context of hypothesis testing. It assumes that students are already familiar with the idea of correlation as a measure of association between two quantitative variables and have had some experience with setting up a null and alternative hypothesis. Otherwise it could be situated at any point within the development of the ideas of hypothesis testing - including as an early activity before seeing a standardized test statistic. Ideally students (individually or in groups) need access to computers, although the activity can also be adapted as a classroom demonstration from an instructor's station. The instruction handout is written assuming students will be using Fathom as the software package - but might be modified for other software that supports the operations to permute the data and collect the sample correlations. Assuming students are already somewhat familiar with the software, the activity takes about 15-20 minutes.
Description and Teaching Materials
Teaching Notes and Tips
- Assuming students are working individually or in small groups, they should be encouraged to look at the results for other students (groups) nearby to recognize that, although their answers are not exactly the same, they should be very similar - especially the general shapes of the plots of correlations under the assumption of no association. This helps motivate the notion that we can find good approximating distributions to do the tests in practice, rather than always relying on simulation.
- As with any simulation, we need to emphasize that the results are still approximations and will differ (hopefully only slightly) from simulation to simulation.
- If students have already seen the traditional test for correlation they can create it in Fathom and check that the p-value (0.0058 for a one tail test) is consistent with what they approximate with the simulation.
Data may be updated from ESPN's website for subsequent years. The original data has average attendance and % of capacity, from which the capacities were computed. A point for discussion might be whether using data from a singel season is reasonable for estimating the correlation for a "populaiton" of all seasons. - For additional motivation, the original question arose from a discussion at a student presentation in Economics where a faculty member suggested using ballpark capacity (which is relatively stable) as a proxy for attendance (which changes from year to year).
- Although many students enjoy the baseball context, a sports example might not be appropriate for some classes. Other data can be substituted easily. A moderately significant correlation works best and it helps if sample units (e.g. the teams in the baseball example) are identified.
Share your modifications and improvements to this activity through the Community Contribution Tool »
Assessment
Formal: A multiple choice exam question asks for interpretation of a p-value giving several of the standard misconceptions (e.g. probability the Ho is true) as possible answers.
Informal: Ask students when doing other hypothesis tests "What does that p-value you just found actually measure?"
Informal: Ask students when doing other hypothesis tests "What does that p-value you just found actually measure?"
References and Resources
The original data on ballpark capacity and attendance can be found at ESPN's website http://sports.espn.go.com/mlb/attendance?sort=home_avg&year=2006&seasonType=2