Simulating Size and Power Using a 10-Sided Die
This material is replicated on a number of sites
as part of the
SERC Pedagogic Service Project
Summary
This group activity illustrates the concepts of size and power of a test through simulation. Students simulate binomial data by repeatedly rolling a ten-sided die, and they use their simulated data to estimate the size of a binomial test. They carry out further simulations to estimate the power of the test. After pooling their data with that of other groups, they construct a power curve. A theoretical power curve is also constructed, and the students discuss why there are differences between the expected and estimated curves.
Key words: Power, size, hypothesis testing, binomial distribution
Learning Goals
By simulating their own data for a binomial test, students will gain a deeper understanding of power and size of tests (beyond being able to recite the definition). They will discover the impact of using different values of an alternative value for the parameter, as well as how power curves are created.
Context for Use
I use this activity soon after introducing tests, and the definitions of size and power. I use this activity in an introductory graduate research methods course, but would also use it in a second-semester methods course for undergraduates. After struggling through these concepts with my undergraduate mathematical statistics students (Hogg and Craig level) this semester, I will also use this activity in that course the next time I teach it.
I assume that the students have already learned about the binomial distribution, and are comfortable using the binomial table to carry out exact tests for a binomial proportion.
I allot a two-hour laboratory session for this activity, but it does not take the entire time. The activity could easily be completed during a 75-minute class period, or during one and a half 50-minute class periods. Of course, if discussion becomes more involved, it will take longer.
Description and Teaching Materials
Materials
Each group (2-4 students) will need one ten-sided die, two tabulation sheets, and a binomial probability table.
Description of Activity
This activity is used during the laboratory section of a graduate level course on introductory statistical methods, and was developed because the students were having trouble with the concepts of size and power. To solidify these ideas in the context of a hypothesis test for a binomial parameter, the students carry out a simulation study based on Example 3.1, page 60, in Dowdy and Wearden (1991).
Hypothesis Test Set-Up: The null hypothesis in the example is Ho:π=0.5 versus the alternative Ha:π ≠ 0.5. To match the Dowdy and Wearden notation, π is used to represent the population probability of success in a binomial experiment.
Simulation Study: The students begin by performing a simulation study to estimate the size of the test (i.e., assuming π=0.5). Each simulated experiment has n=20 trials, and the experiment is repeated 25 times. The simulation study is repeated to estimate the power of the test of Ho:π =0.5 under various alternative values of π. Again, there are n=20 trials in each of 25 simulated experiments. This time, however, the true value of π is something other than 0.5.
Data Collection: To simulate binomial data, the students repeatedly roll a 10-sided die. At the beginning of the lab period, the students arrange themselves into groups of 2 to 4 members, and each group receives a 10-sided die and a particular alternative true value of π. Depending on class size, it may be necessary to rearrange the groups so that there are as many groups as there are alternative π values. The true values that work well with the 10-sided die are π={0.1, 0.2, 0.3, 0.4, 0.6, 0.7, 0.8, 0.9}, which imply a total of 8 groups. On the prototype activity, there is a blank left for the group's π value. This prototype activity is identical to the version handed out during the lab session, and the true π value is filled in by the lab instructor as the directions are distributed to the groups. All groups work with the hypothesized value, π=0.5, in the study to estimate the size of the test of Ho:π=0.5.
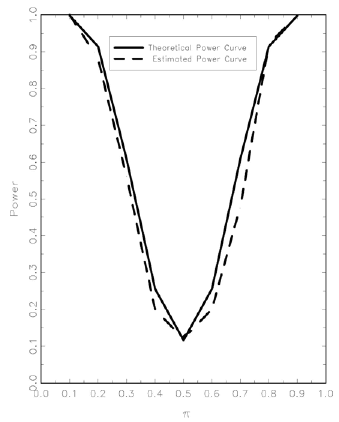
Activity Follow-Up: The prototype activity includes several questions for the group members to discuss during the activity. For example, the group members decide which rolls should constitute a success under their specified value of π. Other discussion questions included in the activity are more abstract. For example, the groups are asked whether the estimated size of the test is satisfactorily close to the theoretical α. It is often instructive for the lab instructor to bring the groups together after they have all completed the activity and discuss these types of questions again. The groups often have different perspectives. The activity also asks the groups to pool their results with the other groups to construct a theoretical power curve and an estimated power curve. It works well to have the lab instructor, after reassembling the groups, construct the power curves on the blackboard using the information supplied by the groups. For the point at π=0.5 (the hypothesized value, used by each group) the lab instructor may pick one at random or may average all of the possibilities. After the curves are constructed, questions about the differences between the curves can be discussed by the class as a whole. This is also a good time to discuss any problems the groups encountered during the activity. Example theoretical and simulated power curves are shown in the graph below.
Assignment Handout (Microsoft Word 462kB Dec4 06)
Teaching Notes and Tips
The activity uses the definition of power as the probability of rejecting the null hypothesis, and so power can be calculated under both the null and alternative hypotheses. Some textbooks specifically define power as the probability of rejection under the alternative hypothesis, and so care must be taken to not confuse the students with a new definition.
This activity also assumes that students are familiar with the binomial distribution, and binomial tables. Instructors who do not go into depth on the binomial distribution can also use the activity, but may have to give the students the rejection region. For using α =0.10 and a sample size of 20, I use the rejection region of 0-6 and 14-20 successes. This gives a realized P(Type I error) of about 0.115. One could also use 0-5 and 15-20 successes as a rejection region, which would give a realized P(Type I error) of about 0.041.
The alternative values of π that work well with this activity are π={0.1, 0.2, 0.3, 0.4, 0.6, 0.7, 0.8, 0.9} so that the ten-sided die can be used, although other true values could be used with a different randomizing device. Sample tabulation sheets for estimating size (π=0.5) and estimating power (for the alternative π=0.2) are included. Also included is an example of a theoretical and estimated power curve plot. (This plot is based on real data, and it looks almost too good!)
Two dice (or more) can be provided to each group to speed up the data collection. The number of rolls and number of simulated experiments can be changed. Another alternative would be to simulate one or two experiments with the dice, and simulate the rest of the experiments using software. Finally, with a small number of groups, the number of alternative values for π could be reduced. The Dowdy and Wearden (1991) text only gives binomial tables for n=20 and n=25, but a more extensive binomial table could be used to accommodate any number of rolls in an experiment, as could an on-line binomial probability calculator. The number of simulated experiments can be changed to fit the amount of time alotted for the activity. The larger the number of simulated experiments, the more closely the estimated power curve will follow the theoretical curve.
The ten-sided dice are available at game stores. They are also available on the web at http://www.paizo.com, and we have had a good experience ordering online from this company.
Share your modifications and improvements to this activity through the Community Contribution Tool »
Assessment
This activity was used in lab because students were having trouble understanding the concepts of power and size; they saw them as abstract ideas. This activity was designed to make those concepts more concrete. Therefore, the test and homework questions previously used to assess student understanding really did not change. The anticipated changes were in the quality of the answers, and the responses did improve. Below is a sample exam question to test an understanding of power (and binomial hypothesis testing in general):
The CDC reported that 6.7% of men aged 45-54 have coronary heart disease (CHD). We want to know if this rate also holds for men who are heavy coffee drinkers (>100 cups per month). To investigate this, 25 heavy coffee drinkers aged 45-54 are randomly selected, and a physician determines the number out of the 25 that suffer from CHD.
- State the most reasonable null and alternative hypotheses to test. Rather than the 6.7% reported by the CDC, use 10% as the rate of CHD so that the binomial tables from the textbook may be used.
- In the context of this example, describe Type I and Type II errors. Which type of error do you consider more serious? Explain.
- If we want to test the hypotheses from (1) at the a=0.05 level, what is the rejection region?
- Suppose 4 out of the 25 men have CHD. What is the conclusion?
- Assume that the true proportion of heavy coffee drinking males aged 45-54 that have CHD is 15%. What is the power of the test under this alternative? What does this value mean?
References and Resources
Dowdy, S. and Wearden, S. (1991). Statistics for Research, Second Edition New York: John Wiley & Sons.
On-Line Binomial Table: http://academic.regis.edu/jwise/table%20%204%20%20and%205.pdf
This manuscript has been assigned Journal Series No. 01-6, College of Agricultural Sciences and Natural Resources, University of Nebraska.