Optional Module Permafrost Ecosystems
Summary
This module focuses on exploring the response of the terrestrial Antarctic ecosystem to climate change. It is intended to introduce students to permafrost, Antarctica's landscape and processes, and the idea that organisms respond to environmental forcing driven by climate and surface processes. Students will interact with data from the McMurdo Dry Valleys LTER that explored an inflection point in the Antarctic ecosystem's response to regional climate change; plot the data, evaluate trends in the data, and draw their own conclusions about whether organisms respond to environmental forcing, and whether the response has been uniform over time or has changed. They will read a news article related to permafrost ecosystem functioning, then pen a letter to the editor based on the data they plot.
Learning Goals
- Students will be able to list the principle landscape elements of the McMurdo Dry Valleys
- Students will be able to describe how water moves through the permafrost environment
- Students will learn how extremophile organisms are adapted to the Antarctic cold desert environment
- Students will be able to describe how organisms respond to environmental change over several years and in response to major perturbations
- Students will gain an appreciation for how permafrost is talked about in the news
- Students will compose a thoughtful letter-to-the-editor based on scientific data they find, analyze, and interpret
Context for Use

![[reuse info]](/images/information_16.png)
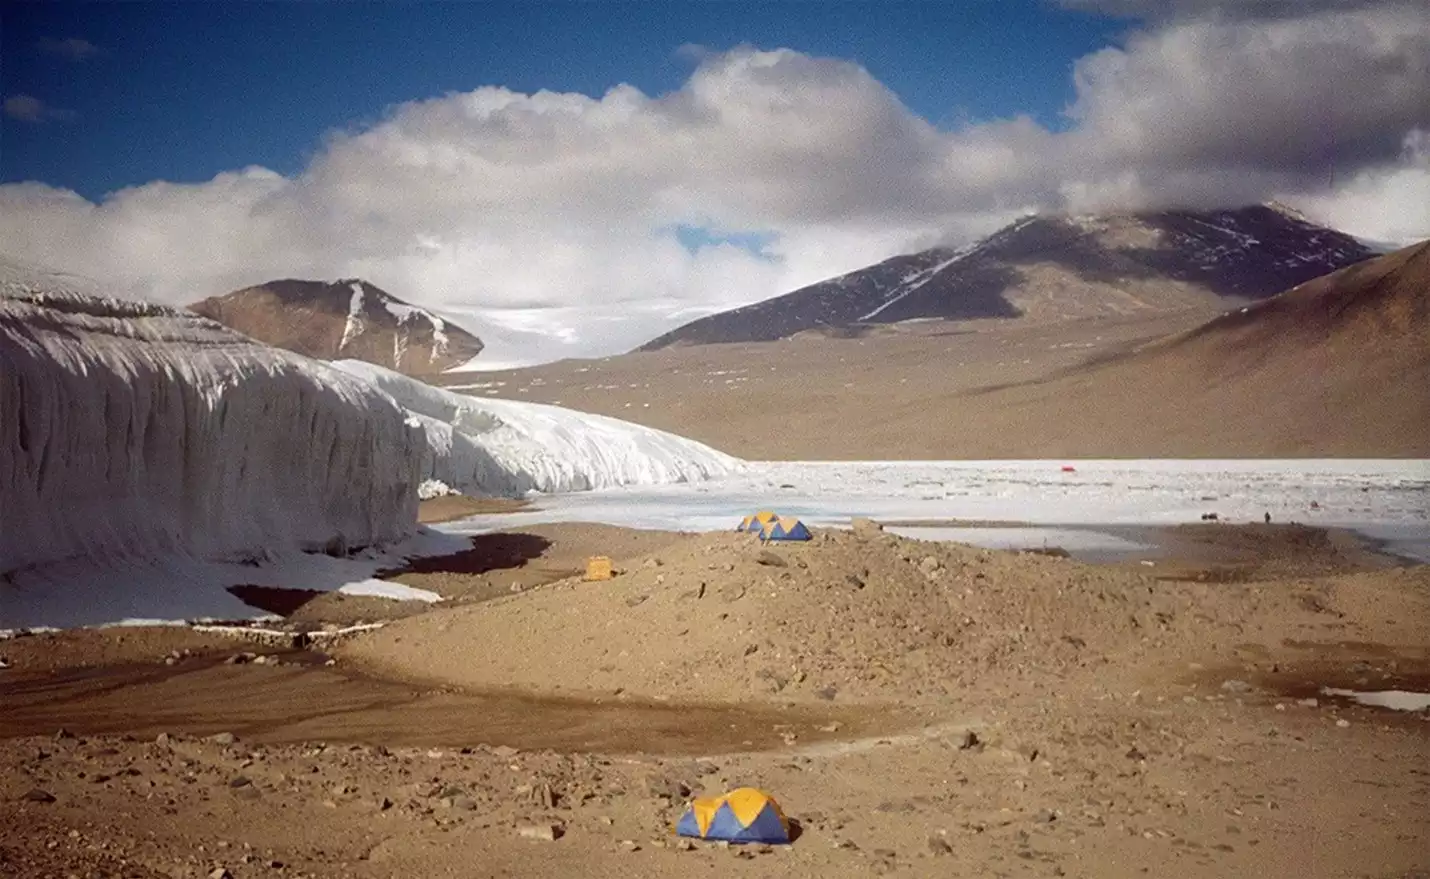
Caption:The U.S. Antarctic Program field camp at Lake Hoare in the McMurdo Dry Valleys, with the Canada Glacier in the background.
Photo credit: Peter West/NationalScience Foundation
The content here is intended to span several 75-minute class periods, where students discuss a news article, have a lecture, complete a pair programming exercise with the aid of instructional videos, and conclude with an opportunity to write a response to the author of the news article read at the beginning of the unit.
If adapting this entire course, this module marks a break point with the original Oceans in the News course. It is the first module where students will explore permafrost processes using the skills developed in the preceding modules. It can be used to replace Module 4, Polar Ecosystems. They will need to use their narrative interpretation skills as well as their R plotting skills to visualize data and draw conclusions. It could be included as part of a different class to introduce Antarctic permafrost and ecosystem processes; however, it will need to be adapted if the previous two modules are not included.
Description and Teaching Materials
This module has a similar outline to other Oceans in the News modules. Students should be given the news story ahead of time and should read it and fill out the Elements of a Story form prior to the first class of the module. The form should be submitted before class, and students should come to class ready to discuss the article.
The first part of class should be spent discussing students' thoughts on the article, and what they thought the heroes, villains, problems, and solutions were. The handout includes several questions on it which can guide how students should be thinking about the article and data as they move forward. Following this, a lecture can be given to introduce students to the key properties of the McMurdo Dry Valleys. This can be done in the same class period or may be spaced out over several class periods to limit the time spent lecturing in any one class period. Additionally, the lecture can be removed entirely and replaced with another method of information dissemination, such as an in-class reading and discussion.
Example topics for teaching about the Antarctic terrestrial ecosystem:
- Landscape and climate drivers
- Antarctic ice sheets and ice-free areas
- Permafrost affected soils
- Hydrology of the Dry Valleys: Glaciers, Streams, Lakes, Soils
- Polar meteorology: Seasonal, Daily, Insolation vs. Sensible and Latent Heat
- Biogeochemical cycles
- Extremophile organisms
- Communities, populations, individuals
- Key taxa
- Macro organisms: penguins, skuas, seals
- Micro organisms: microbial mats, nematodes, tardigrades
- Climate change
- "Antarctic cooling"
- Relationships between temperature and precipitation
- Leading and lagging indicators
This module contains one (long) instructional video, and it is intended that it be allotted two or more class periods for students to accomplish via pair programming. The instructor (and near-peer teaching assistants if available) circulate to help students as needed to make their code. If students do not complete their code in class it can be finished as homework, but encouraging students to complete this work as a pair is encouraged. Students will generate graphs in R, and these can be submitted at the beginning of the next class period for a few points, creating a low-impact formative assessment that encourages students to stay engaged in the class.
After the video has finished and students have generated their graphs, the discussion can return to the article to see if students have different viewpoints after looking at the data themselves. This can occur at the end of the class period or can happen the following class period. The questions on the handout can help facilitate this discussion, and students should now be able to answer all the questions on the sheet except for the last one which requires work outside of class.
Students next focus on finding more data they can analyze that is related to the news story. Students are encouraged to work in their pairs to do this, but can diverge if they choose. Finally, students individually pen a letter to the editor to respond thoughtfully to the news article. This letter should include graphs of the data covered in class and other data the student finds on their own. This serves as the summative assessment for the module, as the letter will show students' grasp of what the article says, what their data says, and demonstrate the students' ability to critically analyze and draw conclusions from both.
- Show Technology/Software Materials
- Module handout and questions
- R Tutorial Videos
- Permafrost Ecosystems
- MCM-LTER Data(Comma Separated Values 2.2MB Mar12 20)
- Permafrost Ecosystems
- Elements of a Story form (Microsoft Word 2007 (.docx) 12kB Dec29 19)
- News article on Antarctic ecosystems
Teaching Notes and Tips
Students are likely to struggle with the heroes, villains, problems, and solutions of the article, so they will need help during the class discussion to ensure everyone understands. While it is best if the students can work through the details as a class, they may need some guiding questions from the instructor to help them reach the correct conclusions. One way to go about this is to first have students list off all the people and things discussed in the article, then categorize them into good, bad, or neutral as presented by the article.
Students may need assistance with accessing the data sets, as the way the website is arranged may change slightly over time. It is suggested that the instructor try to access the data a few days in advance so that any potential problems can be addressed. Additionally, should the websites be inaccessible on the day the students need to access them, it is a good idea to have downloaded copies of the data sets ready to distribute as a backup.
With the R code, if students follow along with the video, they should have little trouble. Where students may struggle is when asked to find their own data sets. This can be particularly daunting for students who have never had to seek out data before. These students may need extra attention and assistance to become accustomed to how to seek out new data sources. An alternative option is for the instructor to provide several suggested data sets for students to access and analyze, as this eliminates the need for students to search for new data but still requires them to choose a data set and work through it on their own.
Assessment
Students should turn in their Elements of a Story form before class, which can be graded. At the end of the module, students will generate a letter to the editor as well as R code with graphs, all of which can be submitted for a grade. The Elements of a Story form is a small formative assessment intended as homework to ensure the students read and understand the news article that is the focus of the unit.
As students work through the code for the video, they will generate several R plots. Having students submit these at the start of the next class provides further motivation to keep pace during class, and anything they do not finish in class they then finish at home.
The letter-to-the-editor (Example Rubric(Acrobat (PDF) 289kB Jan8 20)) is the product that tests understanding of both the news article and the data set analyzed. It goes a step further by having students bring in an additional data set to their discussion, ensuring that students are not just parroting back concepts learned in class but are actively applying them to something not directly worked through in class.
References and Resources
R code files (for instructor reference only)
- Educator-only R file.
- Williams, J."Antarctic cooling pushing life closer to the edge" USA Today,Jan 13, 2002 williams_usa_today.pdf (Acrobat (PDF) 111kB Jun5 25)
- Davidson, K. "Media goofed on Antarctic data / Global warming interpretation irks scientists" SF Chronicle, Feb 4, 2002 Media goofed on Antarctic data _ Global warming interpretation irks scientists.pdf (Acrobat (PDF) 3.8MB Jun5 25)
- Doran, P. "Cold, hard facts" NY Times, July 27, 2006 doran_2006.pdf (Acrobat (PDF) 91kB Jun5 25)
- Data: www.mcmlter.org The McMurdo Dry Valleys Long Term Ecological Research project
- Instructional video. YouTube link