Student's t-test
Initial Publication Date: December 21, 2006
The Student's t-distribution was first introduced by W.S. Gossett in 1908 under the pen name Student. It is useful for:

There are many textbooks and websites available that give a theoretical discussion of the t-distribution, its usefulness, and precautions that should be exercised when using the t-distribution for statistical inference. Most spreadsheet programs and many calculators have built-in statistical functions that readily access relevant statistical information. Mathworld provides a generic discussion of the t-distribution. The links below not only give overviews of the t-distribution but also have online interactive routines for calculating relevant t-distribution statistics.
- Use Compute CI button to calculate confidence limits of a sample mean using mean, standard deviation, and sample size on this interactive site from Texas A&M University
- Confidence Interval (math.csusb.edu/faculty/stanton/m262/confidence_means/confidence_means.html) is a JAVA simulator that can help students better understand the meaning of confidence interval (simulator unavailable).
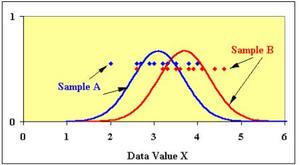
- t-test from College of Saint Benedict Saint John's University Physics Here is an example pdf file (Acrobat (PDF) 81kB Jul29 04) that graphically shows the data, the t-distribution for each sample, and the output tables generated from this t-test site.
When using a t-test of significance it is assumed that the observations come from a population which follows a Normal distribution. This is often true for data that is influenced by random fluctuations in environmental conditions or random measurement errors. The t-distribution is essentially a corrected version of the normal distribution in which the population variance is unknown and hence is estimated by the sample standard deviation.
One should always use care when interpreting the results of a statistical test. For a simple example we look at the hypothetical results of John and Jane measuring the mean mass of 20 pennies from the millions of pennies in circulation. Unknown to either of them, they are given the same 20 pennies but John's scale is biased by +0.2 grams relative to Jane's. A statistical test shows that there is a significant difference between the two sample means. We know this can't be true. The point here is that biases or other nonrandom (non normally distributed) influences on the data can make statistical tests worthless. Also, it is important to realize that we may never be completely certain that all such biases have been eliminated from our observations. Students should always be careful when stating and interpreting the results of statistical tests. Dana Krempels of the University of Miami give a somewhat humorous WARNING on her interactive t-Tester page.
Other References
- An excellent text on statistical applications with many clear numerical examples. G.S. Snedecor and W.G.Cochran, 1989. Statistical Methods, Eight Edition fro the Iowa University Press.
- Hyperstat ( This site may be offline. ) has a good basic discussion of the estimate confidence intervals for correlation and regression.
- Compare Normal and t-distributions with this calculator
- The discussion Presenting Data (more info) provides a good overview of error bars.


