
Downloading USGS Streamflow Data from Internet into a Text File
Purpose
The purpose of this exercise is to demonstrate the steps involved in downloading streamflow records for a gauging station in Indiana into a text file.
USGS NWIS Web Interface
To download the streamflow data, you need to go to the National Water Information System (NWIS) web interfaceat the following link: http://waterdata.usgs.gov/nwis
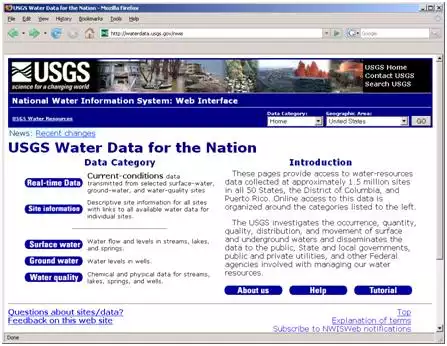
USGS cooperates with other federal, state and local agencies to maintain approximately 7700 streamflow gauging stations in the United States. A stage at most stations is recorded at a fixed interval (5 – 60 minute) which is then converted to streamflow through stage-discharge rating curves. These fixed interval data are available under the Real-time Data link on the NWIS website. All fixed interval recordings are averaged to get daily average values that are available under the Surface water link on NWIS website.
Exploring and Downloading Real-time/Daily Data
Click on Real-time Data button, and you will see the following map with colored dots on it.

Each colored dot represents a USGS gauging station with at least 30 years of streamflow data. A color is assigned to a dot depending on the current flow at the location in terms of percentile, which is computed by using data for the current day of the year for all years. For example, 20th percentile flow means it is equaled or exceeded 80% of the flow values in the data set. For the above map, a data set for each dot includes all values on the current day for all available years. The website gives information on the percentile associated with each color. Typically, a flow equal to or greater than 75th percentile is considered above normal (high), a flow between 25th and 75th percentile is considered normal (average), and a flow equal to or smaller than 25th percentile is considered below normal (low).
Besides just looking at the current conditions at each point, you can also download real-time data in several ways. One (interactive) way is to click on the national map, and it will give you a map at the state level depending on where you click. Click on any point in Indiana, and you should get all stations within Indiana as shown below.

Move your computer cursor over Tippecanoe county (highlighted above), and you will see information associated with each dot in this county. If you find a station that is named "Wabash River at Lafayette, IN", click on it, and you can get access to the data associated with that particular gauging station.

You will also notice that each dot has a number besides its name. For Wabash River at Lafayette, the station number is 03335500. So each USGS gauging station has a unique number associated with it. If you know the station number of a location for which you need data, you can use a quicker way to obtain the data instead of taking the interactive approach as is done in this exercise.
Because we started our search using the Real-time Data link, by default, you will see "Time-series: Real-time data" in the available data for this site bar. You can click on the combo-box and select any type of time series including daily data and other statistics as shown below.

In this exercise we will not only explore or look at real-time data, but also download daily data.
If you scroll down, you will see that by default seven days of discharge and stage data are provided as plots, but you can change the time span to up to 60 days and choose the output format using the options shown below (time is changed to 31 days with graph output).
You can look at the graphs and see how flow and stage has changed at this station for last 31 days.
Next change the available data for this site to "Time-series: Daily data" and you will see that the download options also change as shown below.
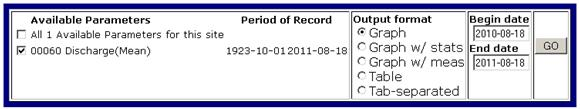
Now you have the option of getting more data than just 60 days as with real-time data, and also notice that the discharge that you are getting now is the mean (daily average of all short-interval real-time values). Again, you can select different output formats as shown in above options.
We are done exploring real time data for Wabash River near Lafayette. Next step is to download data for St. Joseph River Watershed (SJRW) in northeast Indiana. We are interested in downloading data for a streamflow station with 04180000 station number as its unique identifier. Download 10 years of daily data from 01/01/2001 to 12/31/2010.
To download historical daily data, use the daily data link at NWIS website (you can directly use the following link: http://waterdata.usgs.gov/nwis/sw). Select historical observations, and in the next section, check the site number as the selection criterion, and press the Submit button. In the next section, enter the site number as the shown below.
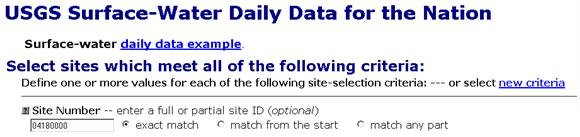
After entering the site number, scroll all the way down to enter the retrieve information as shown below (enter the dates and select Tab-separated data as the output options to display in browser):
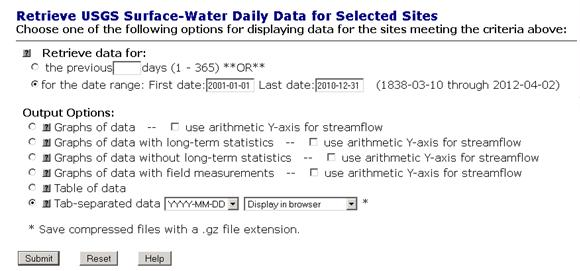
Push the Submit button. In the next browser, you will see a tab-separated text file of streamflow data. After inspecting the file in the browser, save the file as cedar_streamflow.txt.
OK, you are done downloading streamflow in a text file!
Description of output