Part 5—Analyze Data and Propose Location for New Development
Step 1 – Consider the Problem
Your goal is to analyze the data in your project in order to identify the best location for a 25 acre (~100,000 square meters) multi-use development based on the following criteria:
- Within the area defined by the Valdosta Land Use layer.
- No closer than 100 meters (300 feet) of any wetland.
- Not in an area already listed as residential or urban. Preferably in an area that only requires re-zoning (such as industrial or agricultural).
- Within a 15 km (9 miles) distance of Interstate 10.
- Within 5 km (3 miles) of any other access road—as defined by Topo UTM Zone 17 map.
- In close proximity to areas defined as higher income—as defined by the Income and Employment layer.
- Within 100 km (60 miles) of Macclenny, Florida.
Step 2 – Launch My World and Open Project File
- Launch My World GIS by double-clicking its icon on your desktop or by clicking its icon in the dock (Mac) or Launch Bar (Win).
- Choose File > Open Project, and navigate to the file, Wetlands_Part4.m3vz, that you either saved at the end of Part 4 or to the file that you downloaded at the end of Part 4. Select the file, and then click Open.
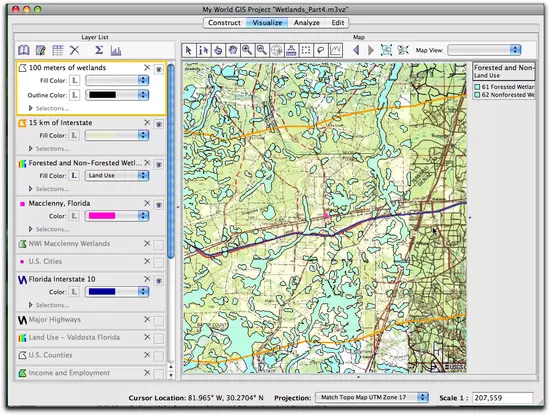
- Spend some time orienting and organizing your map so that you have a clear view of the two buffer layers (Wetlands and Interstate 10) and the topographic map. Note: In the image below the outline of the wetlands buffer layer has been changed to black.

Step 3 – Complete Analysis of Several Alternative Locations
- Once you have your map oriented, use the Zoom and Pan tools to look for suitable sites around the town of Macclenny. You may need to turn layers on and off or change their appearance to improve your view.
- To make a measurement, click on the Measurement
 tool. With this tool active, click and drag a line between your points of interest. The measurement results will be in the lower left-hand corner of the map. You can adjust the units of measurement in Edit > Preferences.
 - While investigating alternatives, make tentative notes of three or more locations that you think would be suitable for development. Note their geographic location by recording the latitude and longitude coordinates that would be the center of the proposed site.
Step 4 – Create a New Layer Showing Proposed Development Site
Once you have completed the analysis phase, you will use My World to create several new polygons that highlight the three proposed development sites. Choose different color schemes for each of the sites and consider the positive and negative factors for each site, based on the criteria given above.
- Once you have found several suitable areas, you will create a new polygon for each site. The polygon will show the boundaries of the proposed development site.
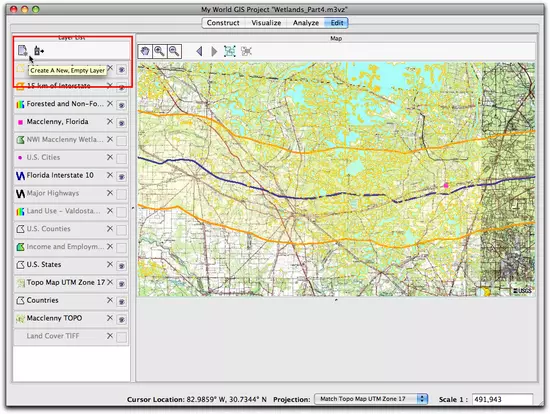
- Switch to Edit mode and click the Create a New, Empty Layer button in the upper left-hand corner of the edit window.
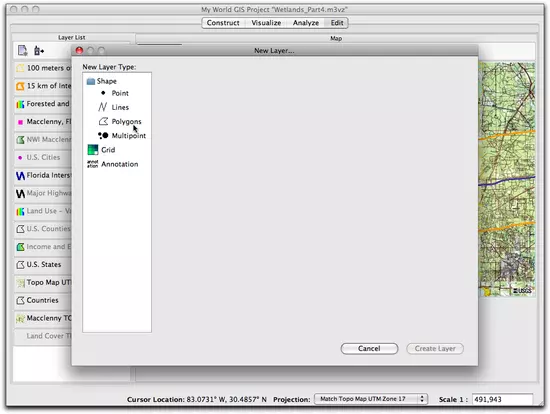
- A New Layer ... window appears, select "Polygons" from the list of layer types.
- Give the layer the name "Proposed Development One" and click Create Layer.

- Next, choose the Polygon tool in the tool bar, click on the map and form a polygon around your proposed development area. Each click of your mouse creates a corner (vertex) in the polygon as you draw. This editing process may take several tries to get the hang of, practice makes perfect! Notice that once you have made a polygon you can use the other tools in the edit tool bar to add or move a vertex. Double click to complete your polygon. You should see a polygon on the map. An example is shown below.
- When the polygon is complete, return to Visualize mode and double click on the "Proposed Development One" layer name in the "Layer List. The click on the Edit Appearance of layer
 button, and change the line width for the polygon to a larger width.
 - After drawing your new layer, you can check the total area (in meters squared) of your proposed development in the table of the layer. To make your new development profitable, you should choose one that is at least 100,000 m2 (approximately 25 acres).


Step 5 – Prepare a Presentation of Your Proposal
Prepare to present your proposal by saving your project and preparing an image of your map by "printing" it.- To prepare your map for printing, choose File > Layout and Print...
- In the Print Preview window, you can turn the legend of a layer on and off, adjust the legend dimensions, add or remove a scale bar and a compass. When you are done setting up the look of your map, click the Print button.
- In the Print Map Dialog box, choose which type of print output you would like, JPEG or PNG files are the best options if you plan to use the graphic in a document.
If you would like a completed version of the My World project click on this link: Wetlands_Part5.m3vz ( 25.6MB Oct12 10). This sample project has three proposed development sites, which show examples of site selections. If you get an error message concerning the Dynamic Web Images, do not be concerned. You can add this layer at a later time once the project is launched.


