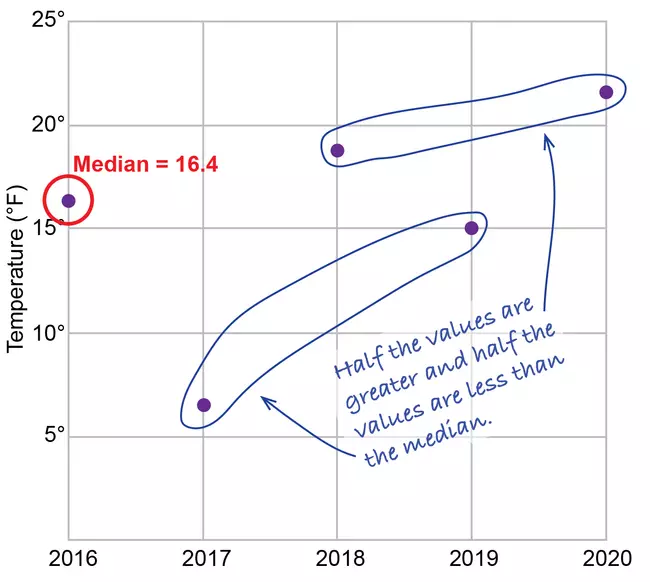
View Original Image at Full SizeGraph of data points showing year vs temperature with the middle point or median highlighted, demonstrates that there are 2 points above and below the median, highlighting that medians will have an equal number of data points on either side. As this a median of the y-axis (temperature), the x-axis is ignored.
Originally uploaded in Math You Need - Majors:Introductory Statistics.
Image 352500 is a 1305 by 1458 pixel WebP
Uploaded:
May2 25
Last Modified: 2025-10-08 16:00:58
Permanent URL: https://serc.carleton.edu/download/images/352500/median.v2.webp
The file is referred to in 1 page
Provenance
Beth Pratt-Sitaula, EarthScope Consortium
ReuseThis item is offered under a Creative Commons Attribution-NonCommercial-ShareAlike license
http://creativecommons.org/licenses/by-nc-sa/3.0/ You may reuse this item for non-commercial purposes as long as you provide attribution and offer any derivative works under a similar license.

