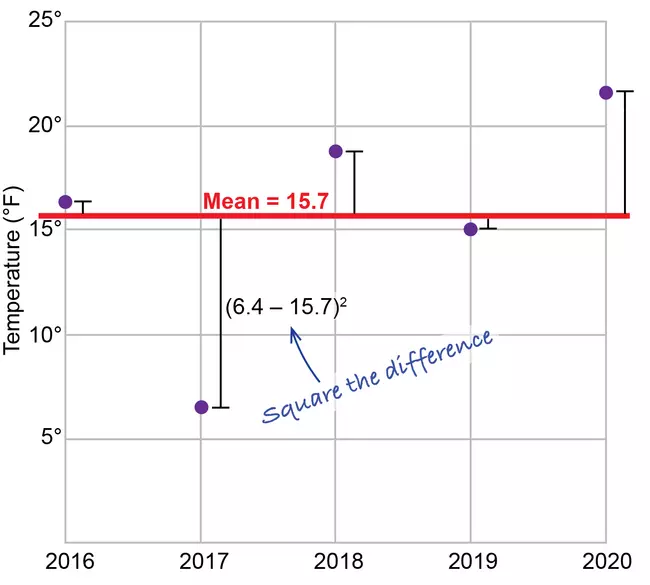
View Original Image at Full SizeGraph of temperature data with mean and difference between the data points and the mean highlighted. Shows that you need to subtract the data value by the mean and square the result.
Originally uploaded in Math You Need - Majors:Introductory Statistics.
Image 352499 is a 1305 by 1450 pixel WebP
Uploaded:
May2 25
Last Modified: 2025-10-08 15:59:01
Permanent URL: https://serc.carleton.edu/download/images/352499/square-the-diff.webp
The file is referred to in 1 page
Provenance
Beth Pratt-Sitaula, EarthScope Consortium
ReuseThis item is offered under a Creative Commons Attribution-NonCommercial-ShareAlike license
http://creativecommons.org/licenses/by-nc-sa/3.0/ You may reuse this item for non-commercial purposes as long as you provide attribution and offer any derivative works under a similar license.

