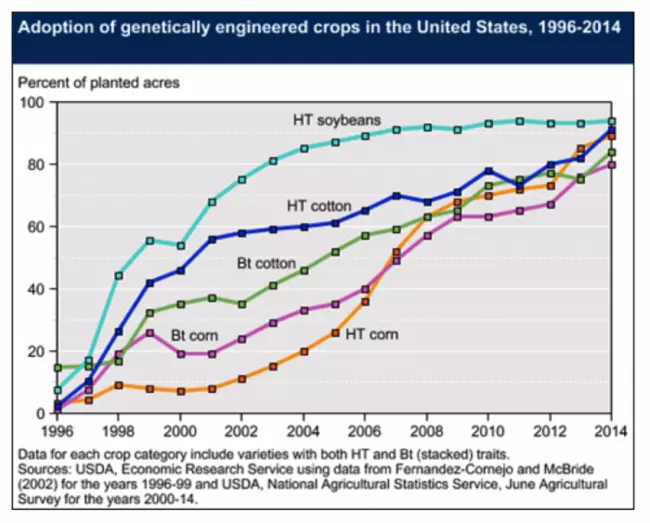


Figure 8.2.15: Adoption of genetically engineered crops in the United States from 1996 - 2014. Data for each crop category include varieties with both HT (herbicide-resistant) and Bt (stacked) traits. Credit: <a href="http://www.ers.usda.gov/data-products/adoption-of-genetically-engineered-crop... Economic Research Service</a>, using data from Fernandez-Cornejo and McBride (2002) for the years 1996-99 and <a href="https://www.nass.usda.gov/Publications/Ag_Statistics/">USDA, National Agricultural Statistics Service</a>, June Agricultural Survey for the years 2000-14.
Originally uploaded in Integrate:Teaching for Sustainability:InTeGrate Modules:Future of Food:Student Materials.
Image 174525 is a 563 by 700 pixel WebP
Uploaded:
Jan3 18