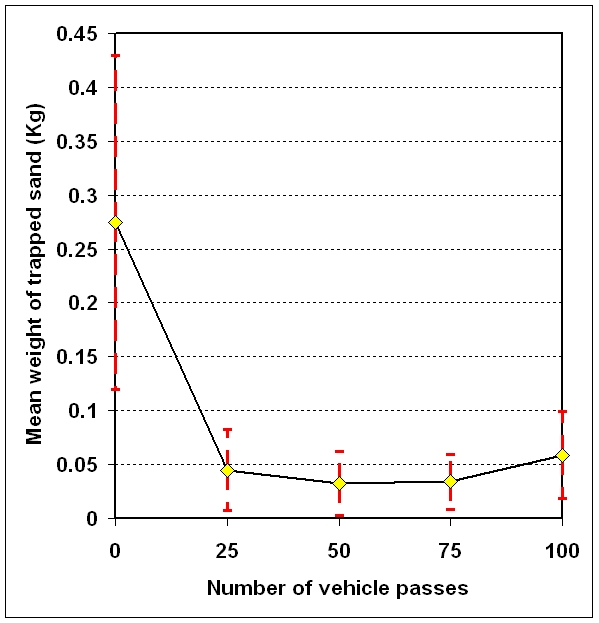
Plot of main effects showing the significant difference between 0 vehicle passes and subsequent vehicle passes. No statistical difference between 25 - 100 vehicle passes
Image 16626 is a 623 by 599 pixel WebP
Uploaded:
Sep12 09
Last Modified: 2009-09-12 00:11:23
Permanent URL: https://serc.carleton.edu/download/images/16626/control_experiment_results.v2.webp
The file is referred to in 1 page
Provenance
Created by the author of the page containing
this file.
ReuseThis item is offered under a Creative Commons Attribution-NonCommercial-ShareAlike license
http://creativecommons.org/licenses/by-nc-sa/3.0/ You may reuse this item for non-commercial purposes as long as you provide attribution and offer any derivative works under a similar license.
