
Lab Overviews

1. Climate, Weather, and Trees
Students are introduced to the relationship between climate and trees and well as the Vermont maple syrup industry, the case study for this module. They consider the habitat and living conditions of a typical maple tree, and the ideal weather conditions for maple syrup production. Students graph, and analyze long-term climate data.
Time required : 180 minutes
Tools and Technology needed: Colored pencils, Internet browser, PDF Reader, Microsoft Excel (optional), Camera and clipboards (optional).
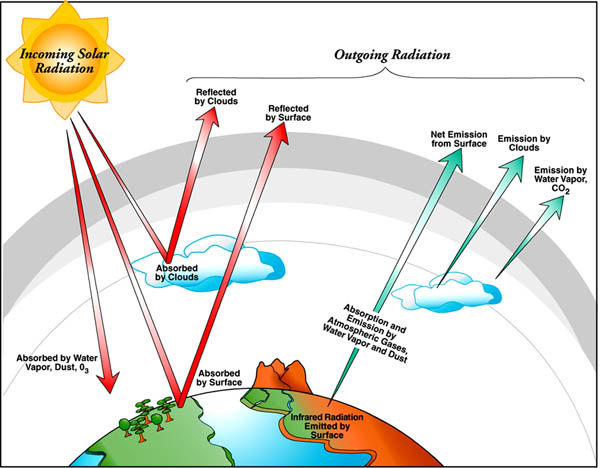
2. Climate and Earth's Energy Balance
Students build and examine a diagram of Earth's energy balance, discussing the inputs, transfers, and outputs of the system. They complete lab activities and simulations to demonstrate the greenhouse effect.
Time required : 150-200 minutes
Tools and Technology needed: Java-enabled Internet browser, PDF Reader, Lab Materials.

3. Climatology Basics: What Factors Affect Climate?
Students complete several demonstration labs; view interactive illustrations and videos; examine maps and diagrams of weather and climate patterns; as they explore the physical factors that influence climate (latitude, altitude, proximity to water). They also learn about the four levels of drivers that create weather and climate at various temporal and spatial scales (global, regional, and local).
Time required : 150 minutes
Tools and Technology needed: Internet browser, PDF Reader, Lab Materials.

4. Climate and Life Patterns (Biomes)
Students learn about Earth's biomes and the intimate connection between those biomes and the climates that help to define them by becoming a biome expert. They use an interactive Google Earth globe to explore global climate patterns and characteristic biomes. After students examine maps and diagrams of biomes and climate patterns, they consider the threats that changing climate patterns could present to existing biomes.
Time required : 150-180 minutes
Tools and Technology needed: Internet browser, Google Earth, PowerPoint (optional).

Students read articles from the National Oceanic and Atmospheric Administration (NOAA), and develop short summaries of unusual weather patterns that have occurred in recent years. They use an interactive illustration and view graphs and data showing indications of climate change. They also examine and discuss maps of changing global temperature and precipitation patterns.
Time required : 150-300 minutes
Tools and Technology needed: Internet browser, PDF Reader, PowerPoint (optional).

Students view graphs of changing global, regional, and local temperatures from both proxy sources (e.g., tree rings; fossilized pollen) and instrumental records. They then collect and analyze a simulated sediment core from a freshwater lake and view maps and animations that demonstrate how preferred habitats of tree species migrate in concert with climate change.
Time required : 150 minutes
Tools and Technology needed: PDF Reader, Lab Materials, PowerPoint.

7. Future of the Forest: Climate Patterns and Life
Students return to the issue of the change in maple syrup production. Using their knowledge of the relationship between climate patterns and biomes, they predict how climate change will alter the maple syrup industry and use modeled temperature and precipitation data to select an ideal habitat range for sugar maple trees. Students then examine other plant suitability maps and explore how climate change is impacting all plant life and what that change means for ecosystems. Students conclude the module by selecting suitable trees for their home region.
Time required : 130-200 minutes
Tools and Technology needed: Internet browser, PDF Reader.