
Poster Session and Demonstrations of New Tools
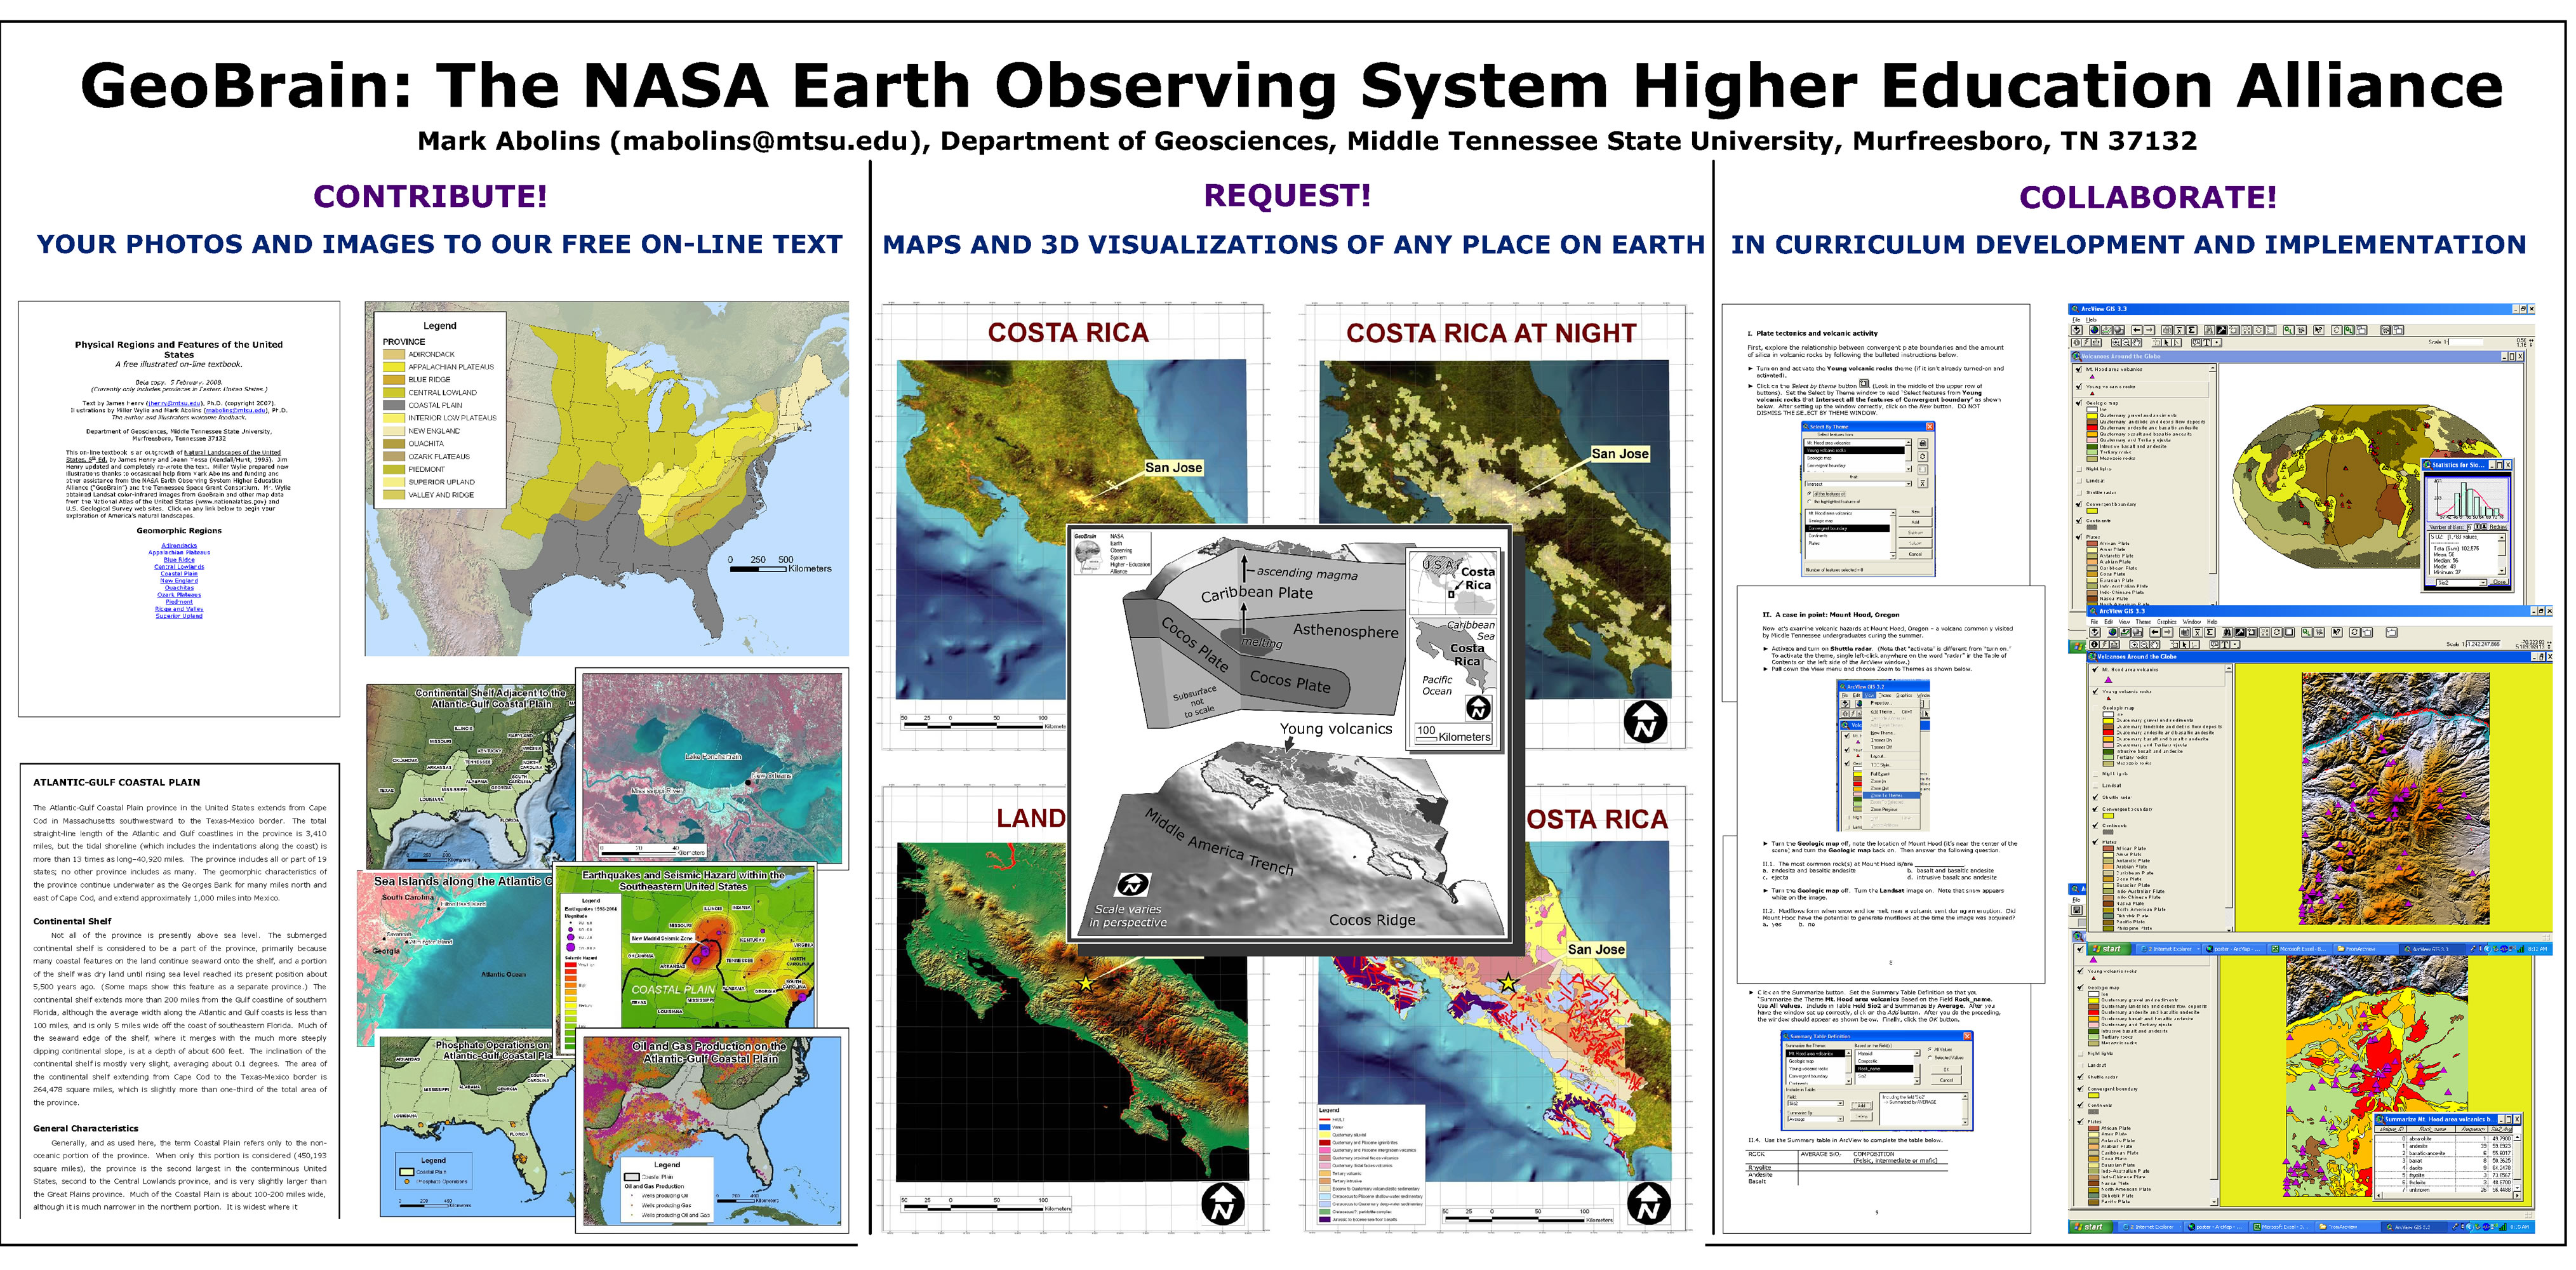
What the NASA Earth Observing System Higher Education Alliance Can Do For You (jpeg image file, 1.6 MB)
by Mark Abolins, Middle Tennessee State University
This poster describes opportunites to (1) CONTRIBUTE landscape photos to a free on-line geography textbook, (2) REQUEST satellite images of anyplace on Earth, and (3) COLLABORATE in the development of computer-based curricula.
Free geography textbook: http://www.mtsu.edu/~mabolins/geomorph.htm (requires Internet Explorer to view)

An exploration of the 2003 Bam (Iran) earthquake in Google Earth
by Gareth Funning, University of California, Riverside
A demonstration of various data types and data sets imported into Google Earth to illustrate my, and my colleagues', investigations of the earthquake. Relevant data include space geodetic measurements of the movement of the ground (made using InSAR), field photos, seismic data and the topographic and optical image data within Google Earth. The intention would be for such material to be used in an exploration-based class activity in a computer lab.
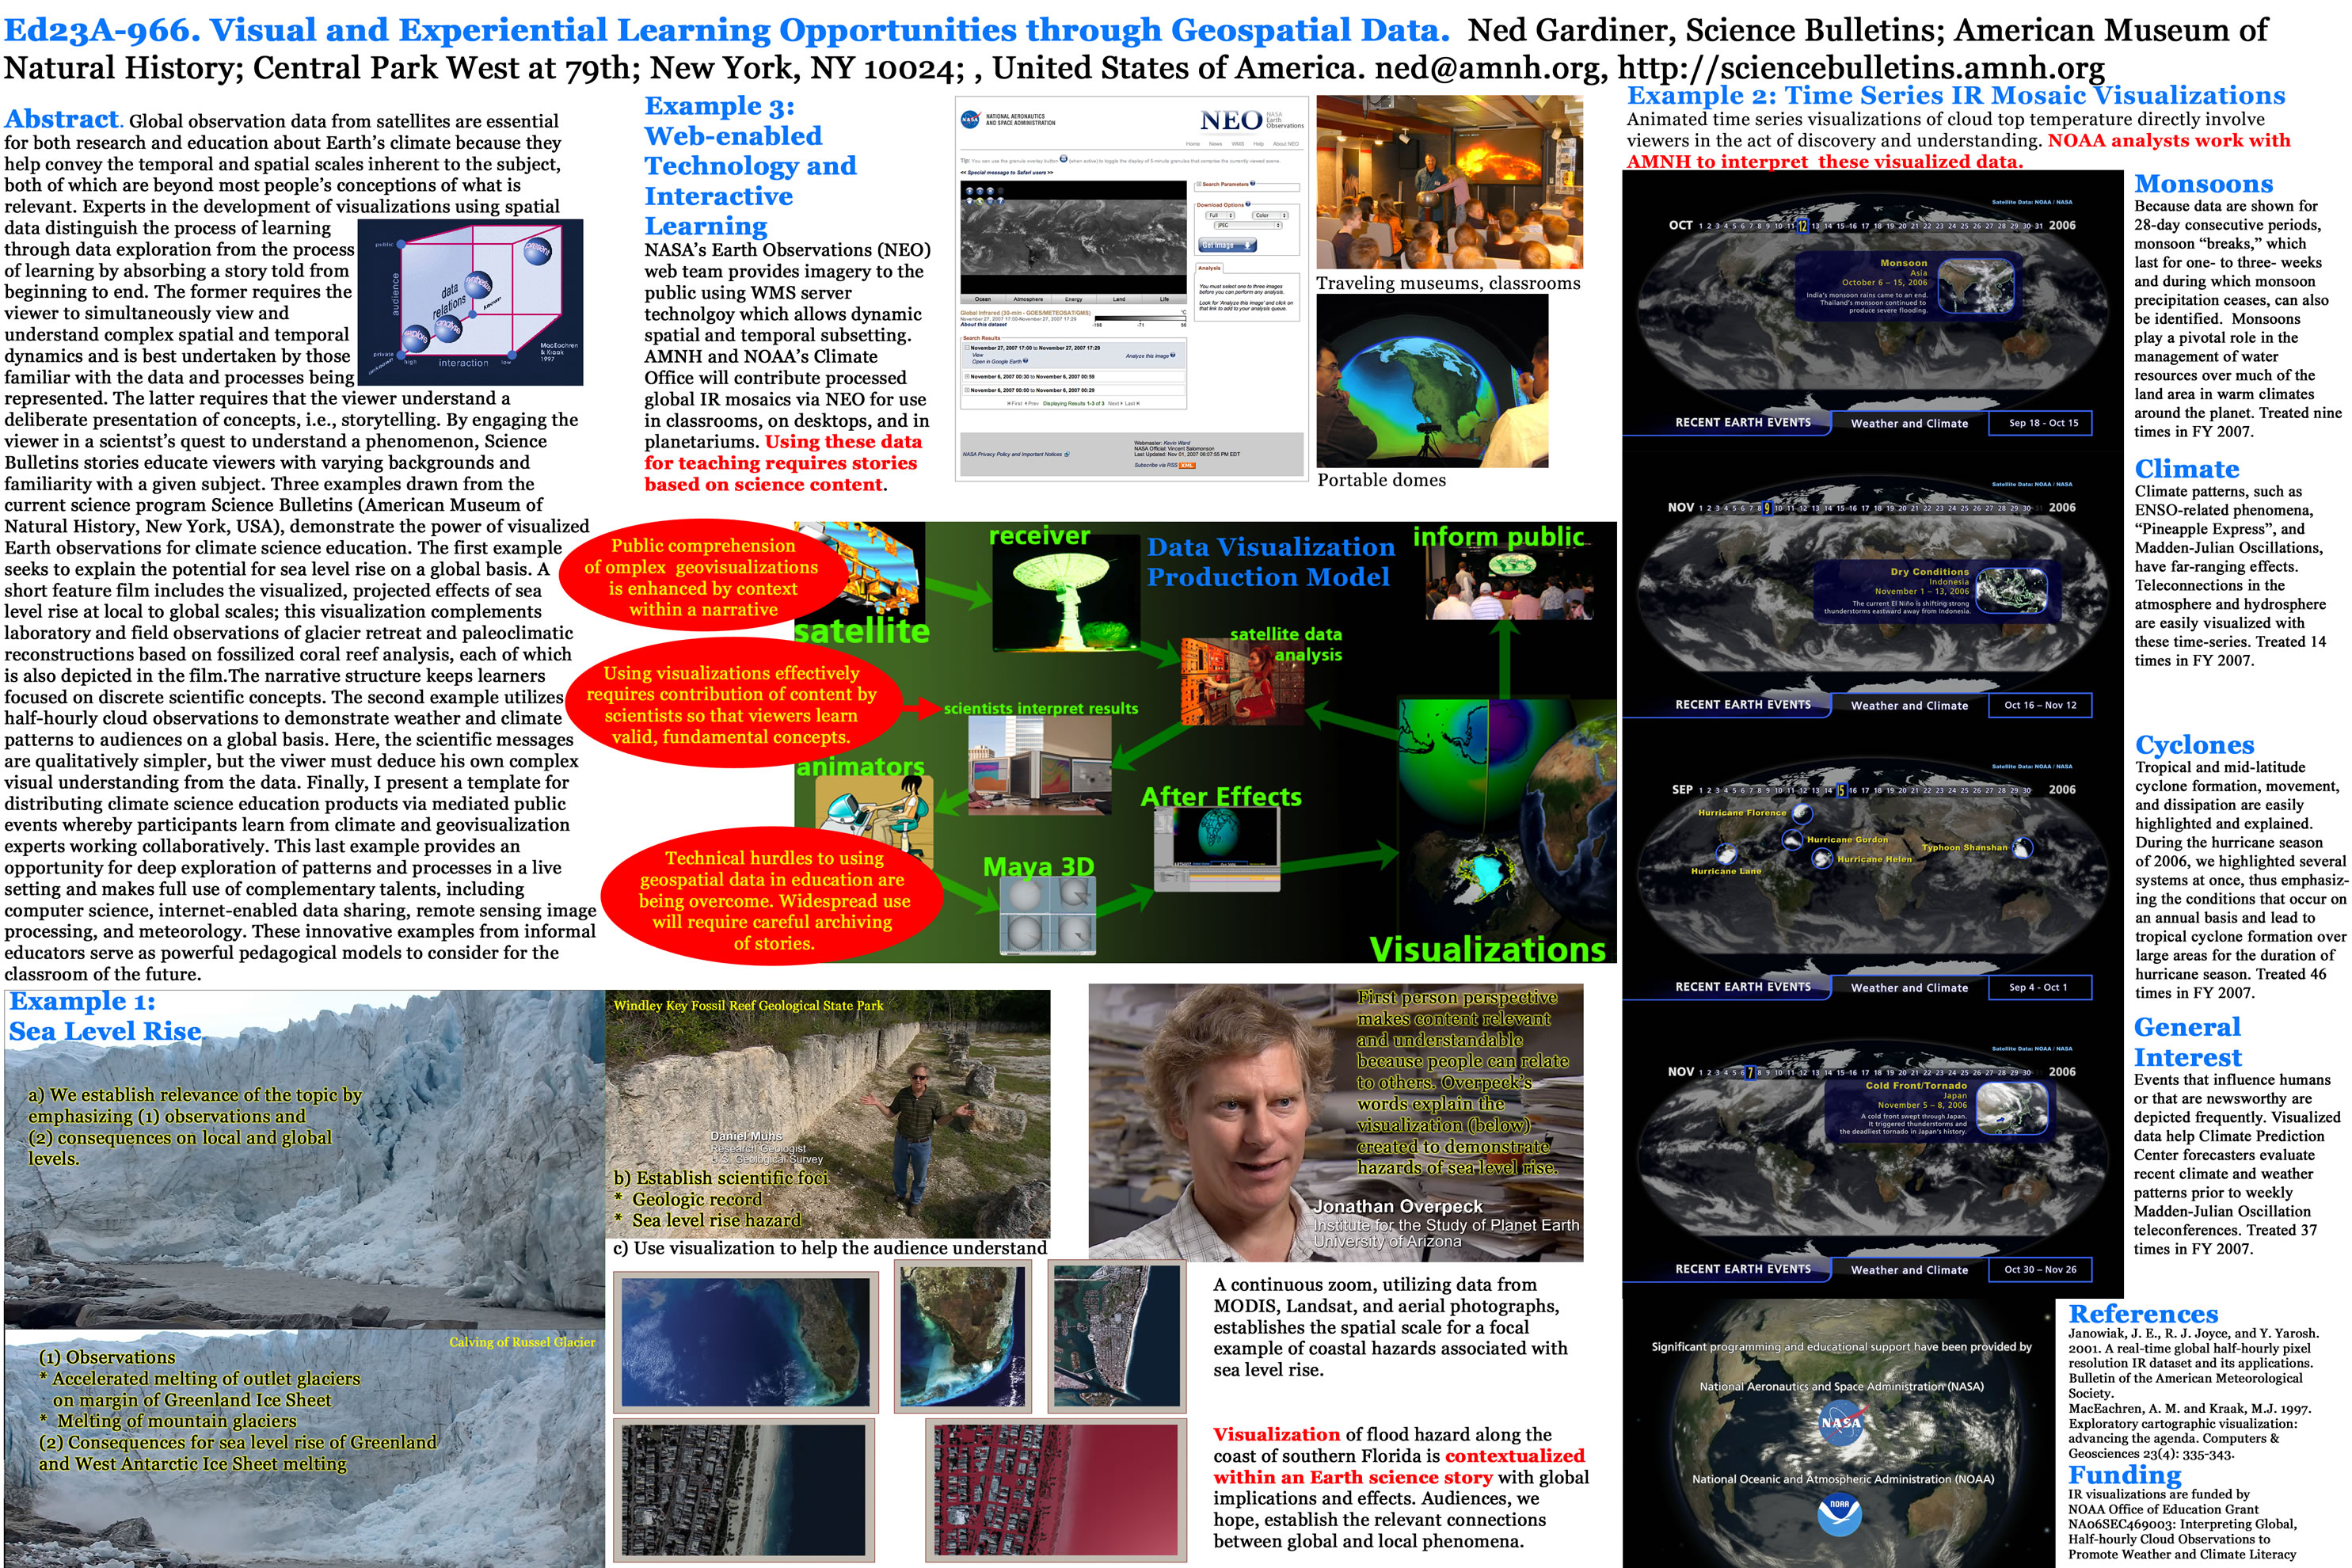
Visual and Experiential Learning Opportunities through Geospatial Data (jpeg image file, 1.6 MB)
by Ned Gardiner, American Museum of Natural History
Storytelling is an effective teaching method. This poster demonstrates three modes of storytelling that employ geospatial data visualizations, or geovisualizations. Embedding geovisualizations within a feature film allows experts on camera to explain the data and imagery. Annotating and animating imagery allows the user to explore data more actively. Providing raw data for building geovisualizations is the most interactive method and requires that the animator understand the story to be conveyed. These methods underlie the use of geovisualization by Science Bulletins at the American Museum of Natural History.
References:
- Science Bulletins from the American Museum of Natural History
- Science Bulletin about weather events

Virtual Fieldwork in Introductory Geoscience Courses: Approaches and Possibilities (Acrobat (PDF) 15.8MB Mar3 08)
by Frank D. Granshaw, Portland State University and Portland Community College

Experiencing Geoscience Through an Immersive Vision Theatre (PowerPoint 673kB Mar3 08)
by Helen King, University of Plymouth
Virtual learning environments are becoming increasingly sophisticated, and dome technology in the form of 'immersive cinema' is one of the most rapidly expanding and exciting areas. EL CETL based at the University of Plymouth, UK has funded the redevelopment of the university's old planetarium into an Immersive Vision Theatre (IVT) for use in teaching, outreach, and pedagogic research.
The IVT is an 8m dome with fixed tiered seating for 40 people. Although originally envisaged as a tool to help preparation for fieldwork, the theatre is finding applications in visualizing complex data sets (including the University's eco-footprint) and invisible processes, the visual and sonic arts, medicine, neuroscience, and the understanding of environments that act on scales in time and space that cannot be observed directly.
References:

Earth Exploration Toolbook (PowerPoint 141kB Mar3 08)
by Tamara Shapiro Ledley, TERC
The poster outlines the components of the Earth Exploration Toolbook, some professional development activities we have to facilitate its use, and some information about how to create new chapters. During the demonstration session at the workshop, chapters in the Earth Exploration Toolbook were explored to give workshop participants an overview of how it might be used and how they might contribute to it.
References:
- Earth Exploration Toolbook home page
- SERC Datasets
- Earth Exploration Toolbook chapter on data tools

Whither Arctic Sea Ice? (PowerPoint 163kB Mar3 08)
by Walt Meier, National Snow and Ice Data Center
A summary of recent changes in Arctic sea ice and its implications for people, wildlife, and climate. The EET chapter on Arctic sea ice is summarized. EarthExploration Toolbook chapter: Whither Arctice Sea Ice?

Climate Change in Google Earth (PowerPoint 139kB Mar3 08)
by Walt Meier, National Snow and Ice Data Center
Examples of changing polar climate from NSIDC's datasets displayed on Google Earth. The files are available from NSIDC's Virtual Globes web page.

Understanding Global Warming through Conceptual Understanding of Change Through Time (PowerPoint 150kB Mar3 08)
by Ed Nuhfer, California State University at Channel Islands
This is a low tech tool. Professors often use hallways for posters that feature their specialty research rather than to teach. Interspersing these with posters that teach about a topic that influences students' lives can make the hallways a teaching annex. This poster features a structured controversy about global warming but gets students to step back from the advocacy and use conceptual thinking to evaluate the controversy in perspective. Most geology students don't know how to think well about geologic time--beyond ages and ordering of events. This poster stresses awareness of other qualities of time that textbooks do not consider. The poster features an exercise that can be started in a gallery walk and completed later.
- Teaching Exercises - Understanding Global Warming and Change Through Time through Interactive Engagement with Authentic Data (Microsoft Word 3.2MB Mar3 08)
 Using GLOBE Student Data to Understand Earth System Science (Acrobat (PDF) 1.7MB Mar3 08)
Gary Randolph, The GLOBE Project
An overview of online GLOBE mapping and graphing tools
Student activities (Acrobat (PDF) 3.5MB Mar3 08) using GLOBE data to support scientific inquiry and to inspire student understanding of Earth science

Using Google Earth to Explore Strain Rate Models of Southern California (PowerPoint 182kB Mar3 08)
by Glenn A. Richard, Stony Brook University
A series of strain rate models for the Transverse Ranges of southern California were developed based on Quaternary fault slip data and geodetic data from high precision GPS stations in southern California. Topography changes are calculated using the model dilatation rates, which predict crustal thickness changes under the assumption of Airy isostasy and a specified rate of crustal volume loss through erosion. The models were designed to produce graphical and numerical output representing the configuration of the region from 3 million years ago to 3 million years into the future at intervals of 50 thousand years. Using a North American reference frame, graphical output for the topography and faults and numerical output for locations of faults and points on the crust marked by the locations on cities were used to create data in KML format that can be used in Google Earth to represent time intervals of 50 thousand years. As markers familiar to students, the cities provide a geographic context that can be used to quantify crustal movement, using the Google Earth ruler tool. By comparing distances that markers for selected cities have moved in various parts of the region, students discover that the greatest amount of crustal deformation has occurred in the vicinity of the boundary between the North American and Pacific plates. Students can also identify areas of compression or extension by finding pairs of city markers that have converged or diverged, respectively, over time. The Google Earth data also reveals that faults that are not parallel to the plate boundary have tended to rotate clockwise due to the right lateral motion along the plate boundary zone. KML TimeSpan markup was added to two versions of the model, enabling the layers to be displayed in an automatic sequenced loop for a movie effect. The data is also available as QuickTime (.mov) and Graphics Interchange Format (.gif) animations and in ESRI shapefile format.
Supporting files:
- Map Tools for EarthScope Science and Education: Strain Rate Models - movies portraying the deformation history in Southern California
- SRM-Cities-Faults-Topo-Time.kmz ( 1.8MB Mar3 08)
- Zipped folder of accessory files ( 3.4MB Mar3 08)
 Using THREDDS in My World GIS (Acrobat (PDF) 1.5MB Mar3 08)
by David Smith, The GLOBE Program
Accessing On-Line data though THREDDS servers and My World GIS

Using 3D and 4D Exploration and Visualization of Geoscience Data with the GEON Integrated Data Viewer (IDV)
by Stuart Wier, UNAVCO
Live demo of IDV used with online data sources. See the GEON IDV web site.