Part 1—Navigate to the Data
Step 1 – Access the GLOBE Website
Click the following link to go to the GLOBE home page. http://globe.gov/ The GLOBE website will open in a new browser window.

![[creative commons]](/images/creativecommons_16.png)
Provenance: Betsy Youngman, none
Reuse: This item is offered under a Creative Commons Attribution-NonCommercial-ShareAlike license http://creativecommons.org/licenses/by-nc-sa/3.0/ You may reuse this item for non-commercial purposes as long as you provide attribution and offer any derivative works under a similar license.
Step 2 – Visualize GLOBE Data
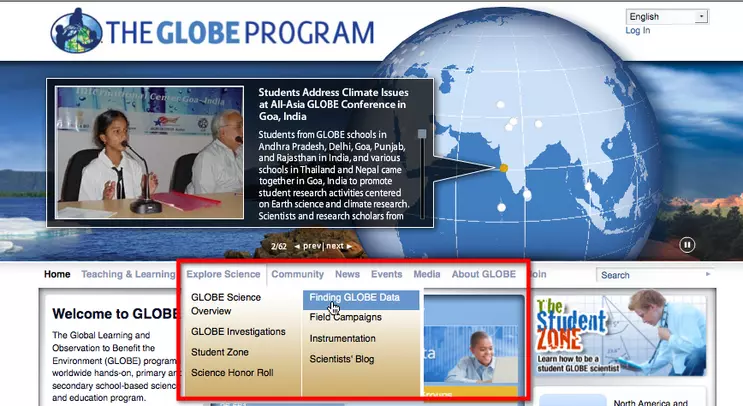
- From the middle menu bar select: Explore Science > Finding GLOBE Data
![[creative commons]](/images/creativecommons_16.png)
Provenance: Betsy Youngman, none
Reuse: This item is offered under a Creative Commons Attribution-NonCommercial-ShareAlike license http://creativecommons.org/licenses/by-nc-sa/3.0/ You may reuse this item for non-commercial purposes as long as you provide attribution and offer any derivative works under a similar license.
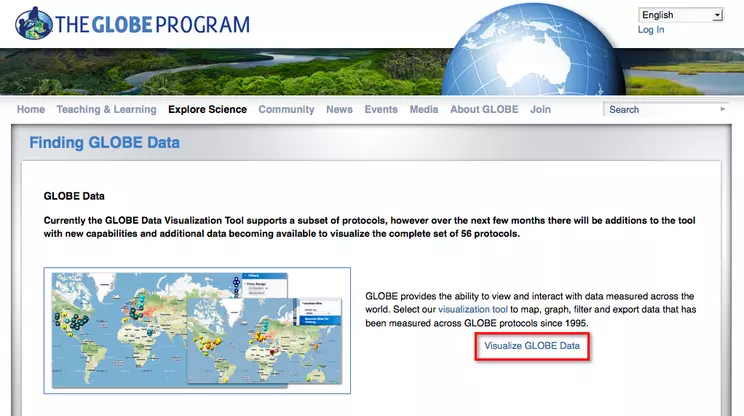
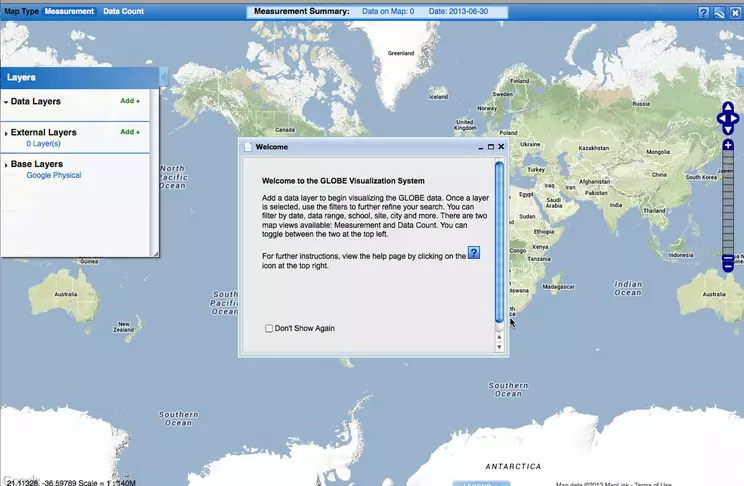
- On the page that opens, click the link to Visualize GLOBE Data. A new map page will open. The page includes instructions on using the map interface to access GLOBE data.
- Read the window that opens and then close the window.
Select the link
Visualize GLOBE Data.
![[creative commons]](/images/creativecommons_16.png)
Provenance: Betsy Youngman, none
Reuse: This item is offered under a Creative Commons Attribution-NonCommercial-ShareAlike license http://creativecommons.org/licenses/by-nc-sa/3.0/ You may reuse this item for non-commercial purposes as long as you provide attribution and offer any derivative works under a similar license.
A new map page will open. The page includes instructions on using the map interface to access GLOBE data.
![[creative commons]](/images/creativecommons_16.png)
Provenance: Betsy Youngman, none
Reuse: This item is offered under a Creative Commons Attribution-NonCommercial-ShareAlike license http://creativecommons.org/licenses/by-nc-sa/3.0/ You may reuse this item for non-commercial purposes as long as you provide attribution and offer any derivative works under a similar license.
Step 3 – Add Data to the Map
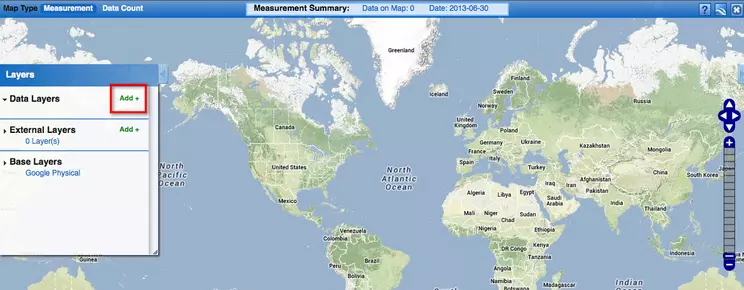
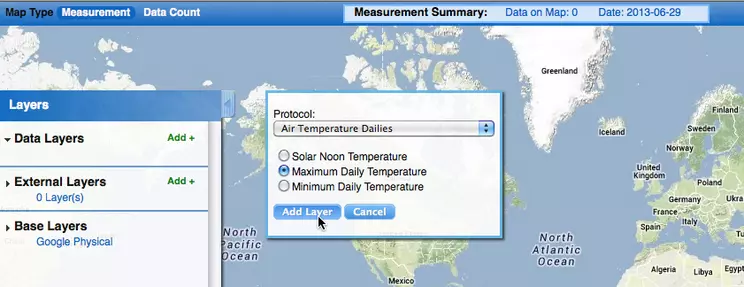
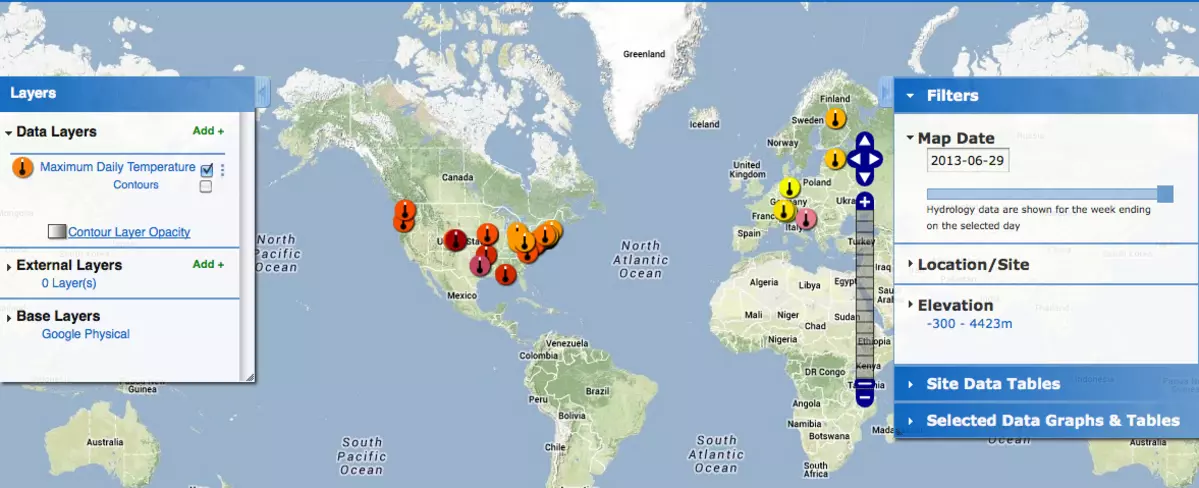
- Click the Add + link in the Layers panel located on the left side of the map. Then, choose the Air Temperature Dailies Protocol and select Maximum Daily Temperature from the list of choices.
- Click the blue Add Layer button located below the protocol choices.
- Symbols indicating temperature records will be displayed on the map. A legend of measurement values will appear. Take a few moments to explore the patterns of the temperature data. Check the Contours check box to see a smoothed data pattern. Change the Map Date (located in the Filters panel) to view the temperature records from other days or years.
![[creative commons]](/images/creativecommons_16.png)
Provenance: Betsy Youngman, none
Reuse: This item is offered under a Creative Commons Attribution-NonCommercial-ShareAlike license http://creativecommons.org/licenses/by-nc-sa/3.0/ You may reuse this item for non-commercial purposes as long as you provide attribution and offer any derivative works under a similar license.


![[creative commons]](/images/creativecommons_16.png)


