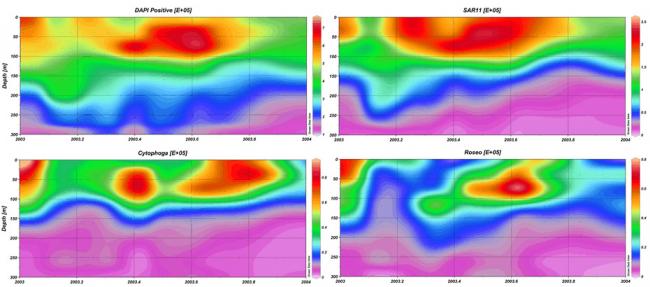


A panel of contour plots showing the temporal and spacial distribution of different bacterial groups in the upper 300 meters at BATS.
Originally uploaded in Microbial Life:Microbial Observatories:Oligotrophic Ocean MO.
Image 5282 is a 410 by 930 pixel JPEG
Uploaded:
Sep13 05