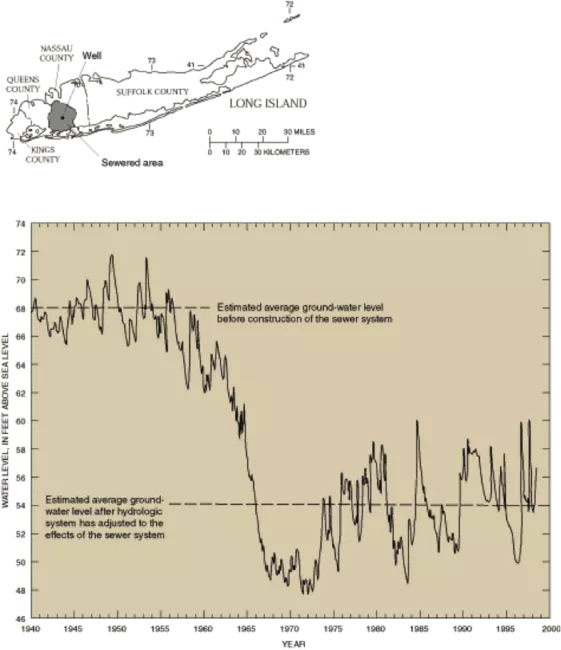


Figure 40. Hydrograph from monitoring well in Long Island, illustrating steady state conditions from about 1940 to about 1960, and a new steady state after the system equilibrated to construction of a sewer system and concomitant reduction in recharge by about 1975. The perturbation (change in infiltration and recharge) led to non-steady conditions from around 1960-1973, manifested in a clear decrease in water level.
Originally uploaded in Integrate:Teaching for Sustainability:InTeGrate Modules:Water Science and Society:Student Materials.
Image 150788 is a 812 by 701 pixel WebP
Uploaded:
Mar28 17