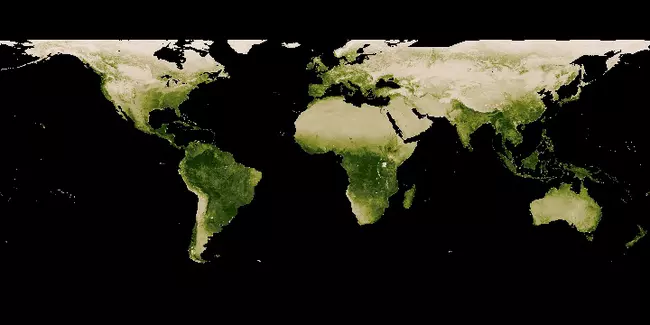


Figure 8. MODIS satellite image renderings of vegetation coverage for July 2013 (top) and January 2013 (bottom). Gradations of green indicating leafy vegetation with the darkest green reflecting highest coverage of plants. Brown colors are ice or desert and black is "no data" (largely the oceans). Note the seasonal differences most pronounced in the northern hemisphere.
Originally uploaded in Integrate:Teaching for Sustainability:InTeGrate Modules:Water Science and Society:Student Materials.
Image 150152 is a 360 by 720 pixel WebP
Uploaded:
Mar28 17