time_series_hotspot_dhw.png

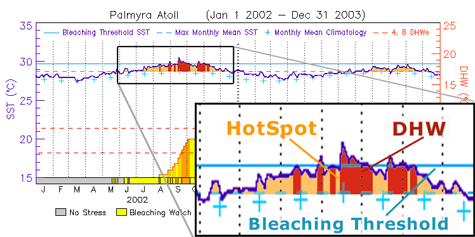
Time series graph demonstrating how to identify bleaching hot spots and degree heating weeks.
Originally uploaded in EarthLabs:Corals.

Image 11792 is a 237 by 475 pixel WebP
Uploaded: Apr28 08


Permanent URL: https://serc.carleton.edu/download/images/11792/time_series_hotspot_dhw.webp


Provenance
Erin Bardar
Reuse
This item is in the public domain
and maybe reused freely without restriction.