Fathoms, Ship Logs, and the Atlantic Ocean
Summary

An inquiry based lesson plan where students use data from ship logs to graph a profile of the Atlantic Ocean. They will rely on prior knowledge of seafloor topography, instructions on how to read a bathymetric map, and observe a demonstration where the depth of the ocean (shoebox simulation) is determined to reinforce mapping principles.
Grade Level: 6 -8
Duration of Lesson: 60-90 min
Learning Goals
- Students construct a profile of the Atlantic Ocean from the east coast of the US to the west coast of either Europe or Africa using the ship log of a ship transit.
- Students will apply their understanding of longitude and longitude and using metric units to construct a graph using this data.
- Students will develop an understanding of how to read a bathymetric map
Context for Use
Description and Teaching Materials
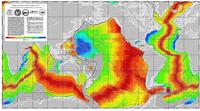
- Viewing a bathymetric map of the Atlantic Ocean with the intent of promoting questions regarding patterns, scale and geography.
- Viewing a shoebox displaying protruding straws of various height and again provoking responses as to why the straws have varying lengths and ascertaining whether their heights are measureable
- Transferring this knowledge to reading data tables from ship logs and creating a graph depicting the data
Teaching Notes and Tips
An inquiry lesson plan that has been scripted with suggested questions and responses along with a powerpoint with notes demonstrating components of this lesson plan. (Be patient loading these large files.)
Students will view a large projection of a bathymetric map and make observations regarding its appearance in a Journal. At least 3 questions relating to the map are to be noted.
Atlantic Ocean bathymetric map
A shoebox is displayed where holes have been poked in the lid in a grid pattern with straws sticking out of the holes. Various objects have been placed inside to mimic sea floor topography.
Probing questions are asked with the goal of leading students to ask whether the bottom of the shoe box could be "mapped" by measuring the various heights of the straws in the shoebox. See attached ppt with notes.
Responses are written on the board. Upon satisfaction that the correct responses have been generated two lists are made. One list contains information useful for the completion of mapping the seafloor and determining its topography. The other list contains data that are not significant to the determination.
Students, through probing questions, are led to the conclusion that depth and distance data will enable them to create a profile of the ocean floor. They are then given one of 4 ship log transits with the instructios to create a profile of the ocean floor.
Students with access to a computer lab can search the Ship Log links and obtain their own ship log.
Ship Logs
- Cape May, NJ to Cape Roca, Portugal
- Nova Scotia, Canada to Soulac, France
- Savannah, GA to Canary Islands
- Delaware to west coast of France
Student worksheets using the scientific method format and graph paper to construct the Atlantic Ocean profile.
Student worksheet: scientific method format for Mapping Atlantic seafloor
Student worksheet: graph paper for Mapping Atlantic seafloor
Assessment
Students are assessed by the completeness of their journal entries and the accuracy of their profile obtained from the data logs. While journal entries don't have to be "correct" they should show that directions were followed. Students will compare the different maps they have graphed. All maps should basically look the same: continental shelf, continental slope, abyssal plain, midocean ridge, trench, midocean ocean ridge,continental slope, and continental shelf.
References and Resources
Teacher at Sea-Mapping the Pacific Ocean
http://www.moaa.org/magazine/June2004/f_neptune.asp