Part 3—Investigate Land Use Data
Step 1 – Launch My World and Add a Legend to the Land Use Layer
If necessary, launch My World, and re-open the project file that you saved in Part 2, Wetlands_Part2.m3vz.
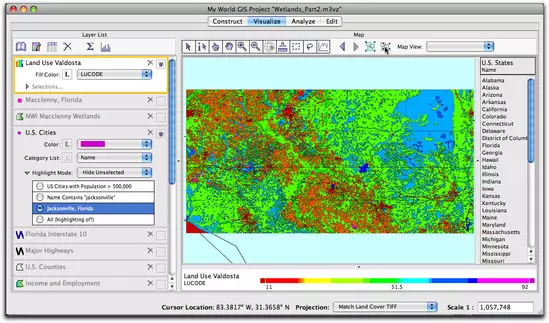
- Make the Land Use Valdosta layer the active layer and zoom to the extent of the active layer
 . Observe that it is difficult to understand the data in this layer, due to the fact that there is no easily interpreted legend built into the layer.
 - Open the Table of the Active Layer by clicking on the Show Table of the Active Layer
 button above the layer list. (It looks like a spreadsheet.) Note the numbers in the field "LUCODE". These numbers are the classification codes that are used to designate various land cover and land uses.
 - Click on the header of the LUCODE field to sort the table ascending and descending. Note the range of the numbers. In this case they range from 11 to 76. Close the table when you are done exploring.
- Open the Land Use and Land Cover Classification PDF that you downloaded in Part 1 of the activity, or download and open the file now. Download classification codes in PDF (Acrobat (PDF) 34kB Oct3 10). This PDF file contains the classification codes and is suitable for printing or viewing online. Save this file to your desktop of documents folder, where you can easily access it later.
- What types of land cover and land use would you expect to find in Florida?
- In My World, choose Layer > Edit Layer Appearance of Layer and click on the Show Histogram/Bar Chart button in the Edit Appearance Window. In the Histogram Window that opens, you can see that the tallest bar (the one with the most records) in the LUCODE field is land cover type 61, which is Forested Wetlands. The second tallest bar is in the 20's which is Cropland or Agricultural land. Try adjusting the Bins in the Histogram with slider tab for a more detailed view.
- Close the Edit Appearance window.
Step 2 – Use Join to Add a New Legend to the Land Use Data
It is possible to add additional fields to the data already in a GIS project by joining it to existing data. In this next step, we are going to add a second, more descriptive, legend to the map.
- Locate the Land Use and Land Cover Classification CSV that you downloaded in Part 1 for use in this step. If you have not yet downloaded it, click on this link to do so now. Download classification codes in CSV (Comma Separated Values 1kB Oct3 10). This CSV file will be joined to the previously-downloaded shapefile for a more descriptive legend. The information in the PDF file that you viewed earlier was transferred into a table and saved as a file type that My World can import (*csv). It is not necessary to open the file once it has been downloaded; however, users may be interested in viewing the headers of the file and noting that LUCODE is one of the headers in both the exisiting layer and the new CSV file.
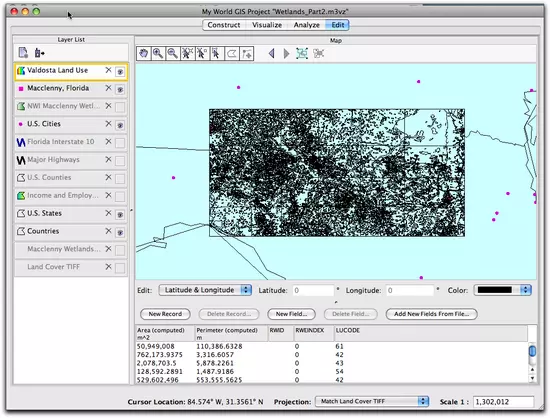
- In My World, click on the Edit tab to switch to Edit mode.
- Double click on the Land Use Valdosta (valdosta.shp) layer to select it for editing. The layer name will be outlined in yellow in the Layer List, and the table of data for this layer will be displayed below the map.
- Click the Add New Fields From File... button.
- An Import Data From... dialog box will open asking you where to locate the file that you want to add to the data. Change the "File Format" drop-down menu, at the bottom of the window to Comma-Separated Values (*.csv). Navigate to the LULC codes.CSV file and select it. Click Open.
- In the next window that opens, you will be asked how you would like to join the data, since both the existing data table and the one that you are joining have a common field name, LUCODE, choose "Field Names".
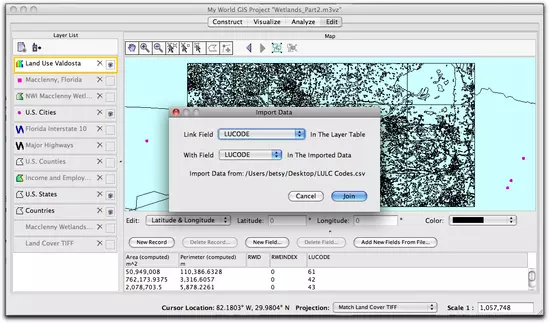
- In the Import Data dialog box, both the Link Field and With Field prompts should have LUCODE selected. This will join the LUCODE in the layer to the LUCODE in the data that you are importing, click the Join button. You will see that a new field, Land Use, has been added to the layer.
- Return to Visualize mode to view the map and edit the coloration of the map.
Step 3 – Simplify the Coloration of the Map
To make the map easier to use, simplify the coloration of the Land Use layer, using the code in the table to the right. This color code is the USGS Level 1 Land Use Color Code. It is commonly used in maps depicting land use types, such as the one you looked at in Parts 1 and 2.
- Choose Layer > Edit Layer Appearance... and from within the Edit Appearance window revise the coloration of the Land Use layer, by clicking on the cell next to the color code. For example, choose Red for all the areas whose code begins with a "1", (i.e., 11, 12, 13, 14 etc. are all colored Red), these are Urban land use areas. All the classes that begin with 2 should be colored Brown and so on. Use the table to the right to guide your color choices. When you are finished editing the colors make the layer more transparent (50%).
- Turn on the Major Highways layer and move the Land Use Valdosta layer below it.
Step 4 – Add Florida Interstate 10 and Consider the Relationship between Land Use and Transportation Corridors
- Turn on the Florida Interstate 10 layer.
- Investigate patterns of Land Use, by clicking on the Land Use Legend to highlight land use types. You may want to use the Zoom to the extent of the Selection
 button to see the selections more closely. Consider the following questions:
- How are the Residential Areas distributed? Are they in close proximity to highways?
- Where are the Agricultural Areas with respect to highways?
- What percentage (approximately) of this area is Wetland?
- When you are done exploring, turn off the Land Use Valdosta layer.
Step 5 – Add a Topographic Map to the Project
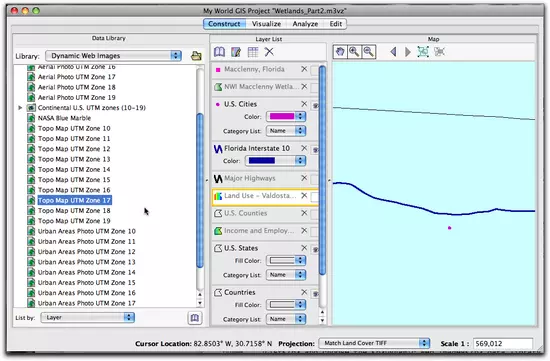
- Select Construct mode, use the Data Library dropdown menu just above and to the left of the Layer List to choose the Dynamic Web Images data library.
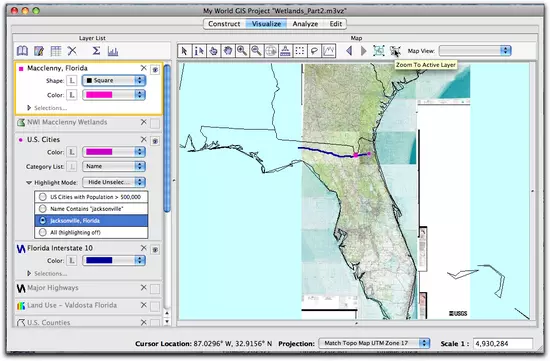
- Scroll down the list and select Topo Map UTM Zone 17. Double click it to add it to the map. It will take a moment to load.
- Return to Visualize Mode and click and drag the Topo Map UTM Zone 17 to the bottom of the Layer List.
- Use the Zoom and Pan to adjust the map to the area around Northern Florida.
- Turn off the Land Use Valdosta layer and turn on the Jacksonville, Florida selection in U.S. Cities.
- Turn on the Macclenny, Florida layer and click the Zoom to the extent of the Active Layer
 button. Adjust the zoom level so that Macclenny is visible on the topo map.
Step 6 – Save the Project File and Quit My World
- Now that you have added the new data, choose File > Save Project As... and name your project Wetlands_Part3, or some other unique name. Then click the Save button.
- Quit My World GIS.
Wetlands_Part3.m3vz ( 20.6MB Oct11 10)
Right-click (PC) or control-click (Mac) the link above to download the file.


