Lab Overviews
- 1. Where's the Water?
- Students explore graphics and analyze data about the distribution and availability of the world's fresh water. They develop a sense of where the world's water is as well as where it's going.
Tools needed: Spreadsheet and graphing program (Microsoft Excel, for example) - 2. What's a Watershed?
- Small groups build simple physical models of a watershed then add model rain to observe and understand the flow of water across land. After working with the physical model, they use Google Earth to explore a rich dataset that characterizes the watershed in which they live.
Tools needed: Pan, plastic sheet, spray bottle, Google Earth - 3. Normal Climate Patterns
- Students explore their location's climate by generating a variety of graphs, charts, and map images. They interpret a broad range of data visualizations to develop their understanding of normal climate.
Tools needed: Browser - 4. When Precipitation Patterns Change
- Students develop a practical definition of drought and explore the role of soil moisture in preventing or promoting it. They learn to interpret precipitation imagery from the National Weather Service and streamflow data in Google Earth; they use these datasets to predict where drought conditions are occurring then check their predictions by comparing them with a current drought monitor map.
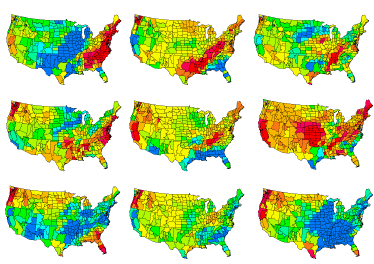
Tools needed: Containers, soil, plastic, Google Earth - 5. Droughts of the Past
- Students watch a PBS video on America's most famous drought and/or interact with the video's companion website. They examine maps and animations that show the distribution of drought patterns over the past 300 years and explore graphics that show the amount of time different areas spend in drought.
Tools needed: PBS video, "Surviving the Dust Bowl" (optional) - 6. Drying of the American West
- Drought conditions in the Colorado River watershed are presented as a case study of drought. Students learn how changes in climate are reducing the amount of fresh water available in the river at the same time that population growth is increasing the demand for water. Students explore how decreasing inflows and increasing outflows threaten to empty major reservoirs on the Colorado River.
Tools needed: Spreadsheet and graphing program - 7. Is Your Region Ready for a Drought?
- Students explore some of the economic, environmental, and social impacts of drought, and consider how they would impact their own communities. Students stage a community meeting in which they role play a range of water managers and water users to make drought preparedness plans for their community.
Tools needed: Browser - 8. Drought Mitigation Trade-offs
- Students research the costs and benefits of technologies that are used for drought mitigation. They prepare physical models to illustrate the principles behind the methods and present their findings to their classmates, including making a recommendation if community should explore the technology further or not.
Tools needed: Variety of lab equipment