Lab 4: When Precipitation Patterns Change
The lab activity described here was created by Betsy Youngman of Phoenix Country Day School and LuAnn Dahlman and Sarah Hill of TERC for the EarthLabs project.
Summary and Learning Objectives
In this activity students develop a practical understanding of the causes and symptoms of drought. They read background articles and prepare a physical model to illustrate the role that soil moisture plays in preventing or promoting drought. Students use Google Earth to examine precipitation and streamflow data and use them to predict locations that are experiencing drought. They check their predictions by comparing them to a drought monitor map. In the final section, students examine and interpret the current map of the Palmer Drought Severity Index.
After completing this investigation, students will be able to:
- Interpret climographs
- Write a practical definition of drought
- Use Google Earth to visualize precipitation and streamflow data
- Correlate current streamflow and drought datasets
- Interpret drought index images to read moisture conditions
Open the Student Lab »
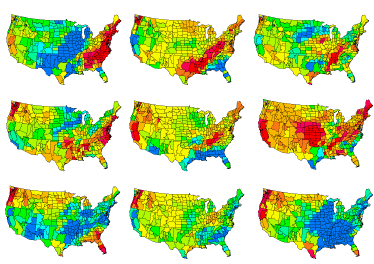 Precipitation patterns during La Niña years. Images produced by NOAA/CIRES - Climate Diagnostics Center - University of Colorado, Boulder
Context for Use
This lab defines drought and how it is measured and tracked. Students build on and use the knowledge they gained about water availability, watersheds, and climate (Labs 1, 2, and 3, respectively) to understand that drought occurs when precipitation falls below normal in a watershed, leading to lower soil moisture, higher temperatures and eventually to reduced streamflow.
Time Required
- Part A: 50 minutes, could be assigned as homework
- Part B: 30 minutes for hands-on activity, 50 minutes for Google Earth exploration
- Part C: 30 minutes, could be assigned as homework
Activity Overview and Teaching Materials
Part A of the activity introduces students to the concept of deviation from "normal" precipitation patterns. Students view and interpret and accumulated precipitation graphs, generated from this page at Southern Regional Climate Center. Students read articles to learn how drought is defined, what the indicators of drought are, and how drought is tracked.
Part B begins with a hands-on activity that demonstrates the role of soil moisture in preventing or promoting drought. The activity could also be performed as a demonstration: it requires 2 small containers, plastic wrap, potting soil, and water. Students also use Google Earth to explore images that show actual precipitation and departure from normal precipitation and streamflow levels. They make predictions about areas of drought and check themselves by examining a Drought Monitor map image.
In Part C, students read articles and examine drought index maps to gain practice interpreting drought index maps and to develop a fuller understanding of the concept of drought monitoring.
Printable Materials
You may want to provide a hard copy of the activity sheet on which students can record their answers:
Word
This file is only accessible to verified educators. If you would like access to this file, please enter your email address below. If you are new to the site, you will be asked to complete a short request form. If you have already been verified by the EarthLabs project, you will be taken directly to the file download page.
,
PDF
This file is only accessible to verified educators. If you would like access to this file, please enter your email address below. If you are new to the site, you will be asked to complete a short request form. If you have already been verified by the EarthLabs project, you will be taken directly to the file download page.
.
Suggested Answers:
Word
This file is only accessible to verified educators. If you would like access to this file, please enter your email address below. If you are new to the site, you will be asked to complete a short request form. If you have already been verified by the EarthLabs project, you will be taken directly to the file download page.
,
PDF
This file is only accessible to verified educators. If you would like access to this file, please enter your email address below. If you are new to the site, you will be asked to complete a short request form. If you have already been verified by the EarthLabs project, you will be taken directly to the file download page.
. Educators are encouraged to customize the questions and add new ones to meet specific learning goals in your location.
Teaching Notes and Tips
If students have access to Internet-connected computers outside of class, Parts A and C can be assigned as homework assignments. The hands-on lab activity in Part B will take most of one class period to set up and record observations. Teachers may decide to do this lab as a demonstration.
Students need basic skills for navigating and controlling which layers are visible within Google Earth. The lab also involves downloading new data sets. If limited bandwidth is an issue, teachers may decide to complete this step ahead of time in order to make sure that the computer lab time is used efficiently. Another option is to have one student in each team set up the hands-on activity while the other downloads the data sets for the Google Earth portion.
Assessment
To assess student understanding, you may decide to collect and grade student answers to the Stop and Think Questions. Another option is to have students capture and describe screen shots of their work in Google Earth.
State and National Science Teaching Standards
Applicable California Science Teaching Standards
Earth Science - Energy in the Earth System
Climate is the long-term average of a region's weather and depends on many factors.
Investigation and Experimentation Standards
g. Recognize the usefulness and limitations of models and theories as scientific representations of reality.
- Select and use appropriate tools and technology (such as computer-linked probes, spreadsheets, and graphing calculators) to perform tests, collect data, analyze relationships, and display data.
Earth and Space Science - Earth Processes and Cycles
- 1.4 Unequal heating of Earth and the Coriolis effect influence global circulation patterns and impact Massachusetts weather and climate.
- 1.8 Ground-based observations, satellite data, and computer models are used to demonstrate interconnected Earth systems.
Physical Setting/Earth Science (PDF - 135 Kb)
STANDARD 4 - Students will understand and apply scientific concepts, principles, and theories pertaining to the physical setting and living environment and recognize the historical development of ideas in science.
- Key Idea 2. Many of the phenomena that we observe on Earth involve interactions among components of air, water, and land.
- 2.1g Weather variables can be represented in a variety of formats including radar and satellite images, weather maps (including station models, isobars, and fronts), atmospheric cross-sections, and computer models..
STANDARD 6 — Interconnectedness: Common Themes. Students will understand the relationships and common themes that connect mathematics, science, and technology and apply the themes to these and other areas of learning.
- Key Idea 2. Models are simplified representations of objects, structures, or systems used in analysis, explanation, interpretation, or design.
1.02 Design and conduct scientific investigations to answer questions related to earth and environmental science.
- Analyze and interpret data.
- Communicate findings
5.02 Evaluate meteorological observing, analysis, and prediction; meteorological data depiction.
5.03 Analyze global atmospheric changes; changes in weather patterns.
Science as Inquiry (12ASI)
Abilities necessary to do scientific inquiry
- 12ASI1.3 Use technology and mathematics to improve investigations and communications. A variety of technologies, such as hand tools, measuring instruments, and calculators, should be an integral component of scientific investigations. The use of computers for the collection, analysis, and display of data is also a part of this standard. Mathematics plays an essential role in all aspects of an inquiry. For example, measurement is used for posing questions, formulas are used for developing explanations, and charts and graphs are used for communicating results.
Understandings about Science and Technology
- 12EST2.2 Science often advances with the introduction of new technologies. Solving technological problems often results in new scientific knowledge. New technologies often extend the current levels of scientific understanding and introduce new areas of research.
Additional Resources
Background Information
Excellent resources explaining drought, drought indicators, impacts and monitoring techniques are available from the National Drought Monitor Center at the University of Nebraska-Lincoln.
