Downloading Annual Peak Streamflow Data from USGS
Siddharth Saksena, Purdue University-Main Campus
Initial Publication Date: December 14, 2016
Introduction
This step demonstrates how to download the United States Geological Survey's (USGS) annual peak streamflow data recorded at a USGS gauging station in the United States. In this step, the students will use the gauging station number 03335500, which represents the USGS gauge located at Wabash River at Lafayette, Indiana. Generally, a minimum time period of 30 years is considered ideal for flood frequency analysis and therefore, the annual peak streamflow data from 1981 to 2015 is used in this step.
Practical Outcomes
Students will be able to search for, view and download annual peak streamflow data from the USGS website. Further, the students will be able to import the streamflow data in text format into MS Excel which will be used in subsequent steps.
Time Required
15 minutes
Computing/Data Inputs
Text: USGS gauge station name (USGS 03335500)
DateTime: Start date/time (1981)
DateTime: End date/time (2015)
Computing/Data Outputs
Numerical Values: Time series of annual peak streamflow for thirty five years in a text file.
Hardware/Software Required
- Internet Browser
- Notepad
- MS Excel
Instructions
To begin with, type the name of the USGS station number and gauge name in the internet browser (USGS 03335500 wabash river at lafayette) and click on the National Water Information System's Web Interface for the site as shown below:
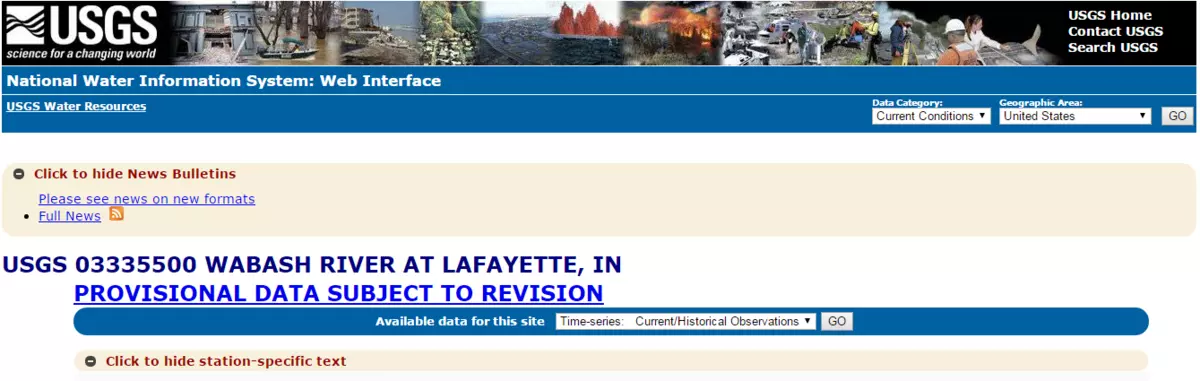
Screenshot of NWIS Interface in the United States Geological Survey Website for current streamflow conditions
![[creative commons]](/images/creativecommons_16.png)
Provenance: Siddharth Saksena, Purdue University-Main Campus
Reuse: This item is offered under a Creative Commons Attribution-NonCommercial-ShareAlike license http://creativecommons.org/licenses/by-nc-sa/3.0/ You may reuse this item for non-commercial purposes as long as you provide attribution and offer any derivative works under a similar license.
Now click on the arrow next to 'Available data for this site' and select 'Surface Water: Peak Streamflow'. You will be directed to a new window as shown below:
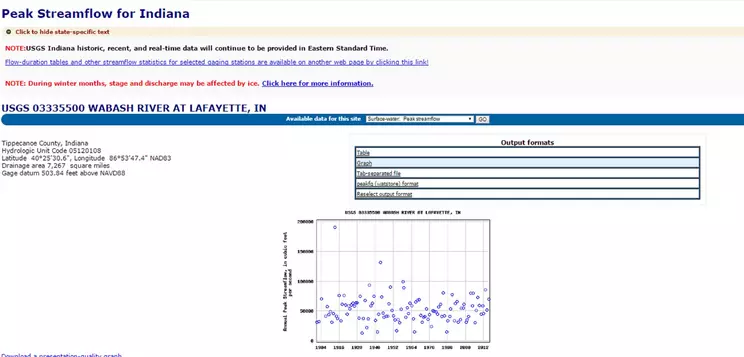
Screenshot of NWIS Interface in the United States Geological Survey Website
Provenance: Siddharth Saksena, Purdue University-Main Campus
Reuse: This item is offered under a Creative Commons Attribution-NonCommercial-ShareAlike license http://creativecommons.org/licenses/by-nc-sa/3.0/ You may reuse this item for non-commercial purposes as long as you provide attribution and offer any derivative works under a similar license.
From the 'output formats', select tab separated file option. A file with information on the annual peak streamflow will open up. Select the entire data on the new page and copy in a notepad file and save the file as USGS03335500. For more information on downloading data from USGS website, please refer to http://serc.carleton.edu/hydromodules/steps/dm1.html.
The saved file in notepad will look like the image below:
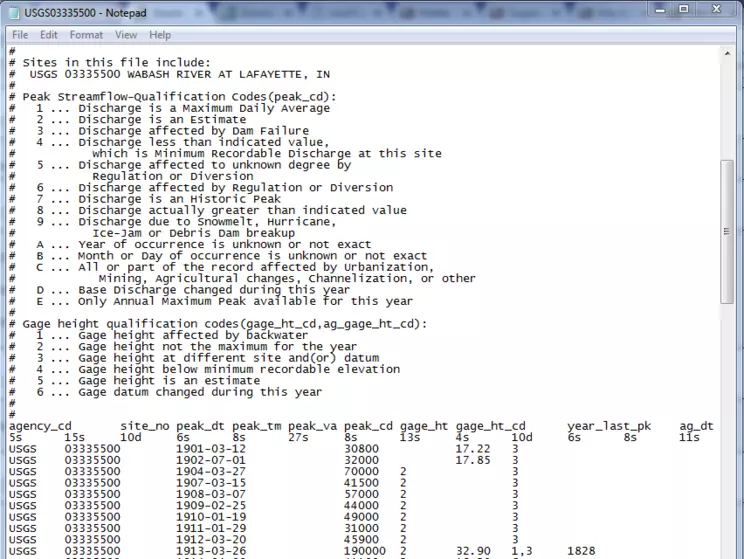
Screenshot of notepad image after downloading oeak streamflow from NWIS
Provenance: Siddharth Saksena, Purdue University-Main Campus
Reuse: This item is offered under a Creative Commons Attribution-NonCommercial-ShareAlike license http://creativecommons.org/licenses/by-nc-sa/3.0/ You may reuse this item for non-commercial purposes as long as you provide attribution and offer any derivative works under a similar license.
Now, open MS excel and in a blank workbook, select the 'Data' tab and click on the 'From Text' option. In the new window, select the notepad file USGS03335500 and click on 'Import'. The MS Excel window will open up a text import wizard that allows importing data from text files in a specific format. Select 'Delimited' in Step 1 and click on Next as shown below:
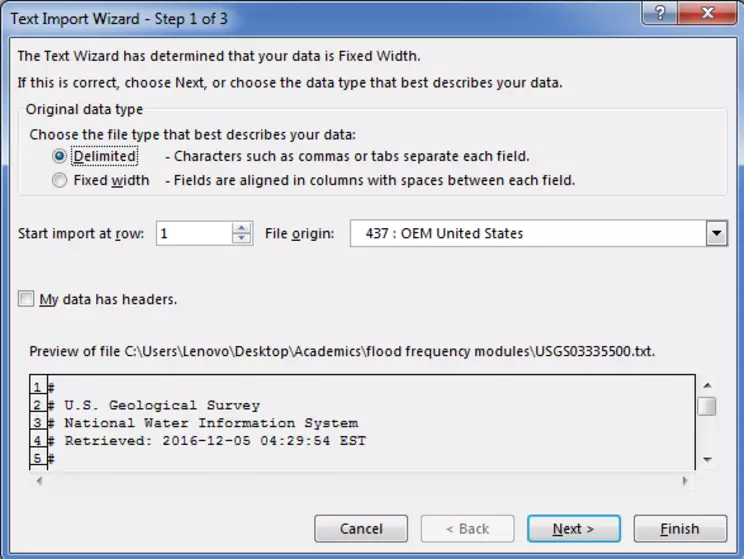
Screenshot of MS excel text import wizard after downloading Peak streamflow from NWIS
Provenance: Siddharth Saksena, Purdue University-Main Campus
Reuse: This item is offered under a Creative Commons Attribution-NonCommercial-ShareAlike license http://creativecommons.org/licenses/by-nc-sa/3.0/ You may reuse this item for non-commercial purposes as long as you provide attribution and offer any derivative works under a similar license.
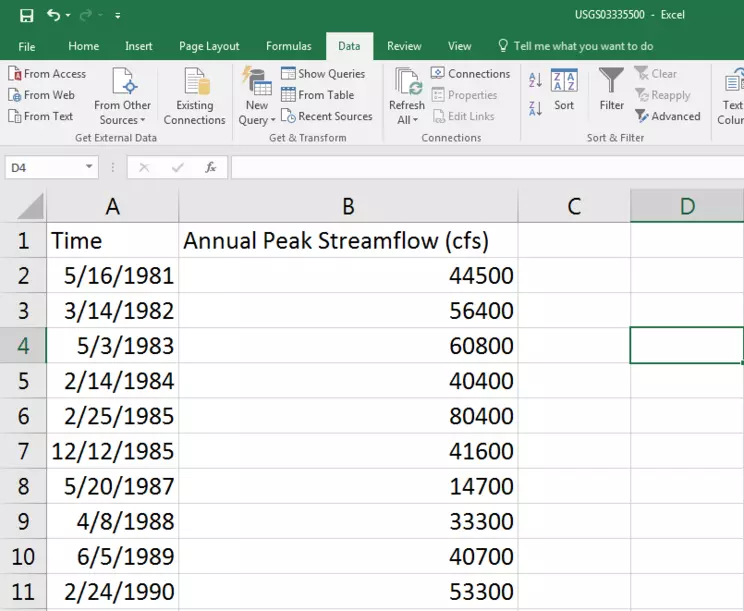
In the step 2, click on 'Tab' in the delimiters menu and click on Next. Click on Finish. Select the first cell of the workbook to import the data in the next window and save the excel workbook as 'USGS03335500'. After saving the excel workbook, select the data in the columns named 'peak_dt' and 'peak_va' and delete everything else. Rename the tab 'peak_dt' as 'Time' and 'peak_va' as 'Annual Peak Streamflow (cfs)'. Here, 'cfs' refers to cubic feet per second which is the unit for measurement of streamflow. Now, delete all the data prior to 1981 from both the columns to only include 35 years of data in the excel sheet.
The final excel file should look as shown in the image below:
Screenshot of MS excel text import wizard after downloading oeak streamflow from NWIS
Provenance: Siddharth Saksena, Purdue University-Main Campus
Reuse: This item is offered under a Creative Commons Attribution-NonCommercial-ShareAlike license http://creativecommons.org/licenses/by-nc-sa/3.0/ You may reuse this item for non-commercial purposes as long as you provide attribution and offer any derivative works under a similar license.
Save the excel sheet.
Okay, you are done downloading annual peak streamflow data into a text file and importing it into an excel workbook!
