
Unit 2: Mapping Patterns
Developed by Kathryn Baldwin (Eastern Washington University), Jennifer Dechaine (Central Washington University), Rodger Hauge (Eastern Washington University), and Gary Varrella (Washington State University)
Summary
In this unit, students work in small groups to examine and analyze spatial data relevant to soils to identify patterns. They use their analyses to add detail to their Earth systems concept maps and describe how these data are relevant to interdisciplinary societal issues.
Learning Goals
By the end of this unit, students will:
- Record and interpret data they collect from maps
- Discuss how map data informs interdisciplinary issues working across multiple Earth systems
- Apply map data to Earth's systems and add map concepts to an Earth systems concept map
Context for Use
This unit is designed for elementary education pre-service teachers in an undergraduate or graduate level science teaching methods course. It could be easily modified for non-teaching students by altering questions that refer to teachers, future classrooms/students, or standards. It is designed for a lab or block-type course where the instructor has 2.5–3 hours at one time. The activity consists of small group and whole class sessions prior to and following student activities interpreting map data.
This unit is the second of four units within the Soils, Systems, and Society module. Although the activities described here can stand alone, the other units are referred to and provide more context.
Description and Teaching Materials
Discussion of Soils and Society Issues Homework (20 min)
Students should have brought their completed Soils and Society Issues Homework Assignment (Microsoft Word 2007 (.docx) 21kB Jan6 16) given at the end of Unit 1 to the start of class.
- Put students into small groups of 3–5. If students will be working in small groups for their Kit, it would be beneficial if they started working in those groups at this time. Ask the students to discuss these questions in their small groups:
- What issue and related testable question(s) did you research?
- What data did you suggest collecting to address that question and what method(s) could be used to collect that data?
- Describe the nature of the data being collected for these issues (i.e., is it observational? Experimental? Field-based? Quantitative? Qualitative?). Are these specific to Earth science?
- What other disciplines (e.g., biology, geology, policy, economics, political etc.) use these data or apply these data collection methods?
- Circulate through the class checking homework and facilitating discussion using formative questioning. Make note of issues and soils data to refer to during later discussion.
- Ask students to report out the highlights of their discussion to the class.
Mapping Patterns (1.5 hours)
Working in small groups, students examine printed maps of topography, precipitation, soil type, and land use, and answer questions about data patterns in their science journals, then teach each other in a jigsaw exercise about the data (learn more about jigsaw exercises). To introduce the activity, you might need to remind students that maps can provide data for investigating questions (this may be a new idea to them).
- Agriculture – A Cornerstone of Washington's Economy, from the Washington State Department of Agriculture (WSDA)
- Washington Mean Annual Precipitation, from the Washington State Department of Transportation (WSDOT)
- Topographic map of Washington State made with TopoCreator
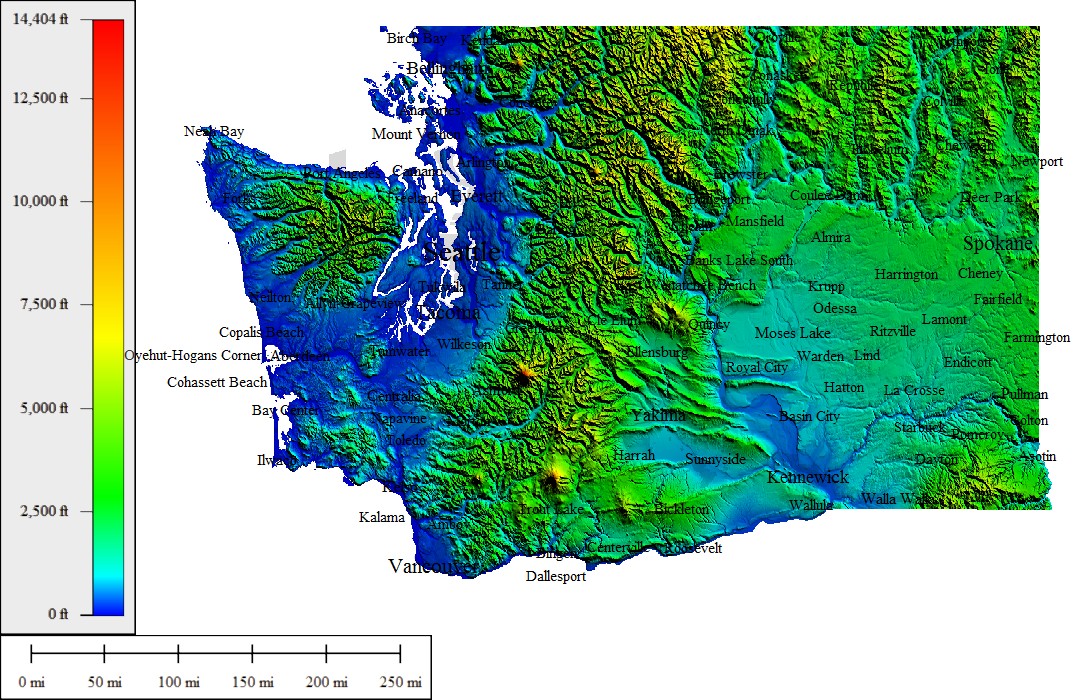
Map resources and information for other states are listed below under Resources and References.
- Put students into the same number of groups as the number of maps you want them to analyze. Each group will examine one map in detail and answer these questions:
- As you examine your map, what patterns do you notice?
- How do the data vary across the state?
- Locate our school on the map. What are the data for our local region?
- How do our local data compare to other parts of the state?
- Jigsaw the groups by taking one member of each group to form new groups that all have an "expert" on each of the maps. Each new small group should answer the questions listed below. Facilitate the small group discussions by asking leading questions that focus students' attention on specific parts of each map. Specific leading questions are given under some of the focal questions.
- Compare the agriculture and precipitation maps. What might you infer about the relationship between agriculture and precipitation based on the patterns you observe?
- What crops are grown in areas of less than 10 inches of annual precipitation?
- What crops are grown in areas of more than 180 inches of annual precipitation?
- Where are these low and high precipitation regions located in the state?
- Compare the precipitation and topographic relief maps. What might you infer about the relationship between climate and topography based on the patterns you observe?
- Examine all maps. Explain how the other three maps influence the local and statewide distribution of agricultural crops and economic value.
- Optional as time allows: For NGSS states: Identify the Science and Engineering Practices, Disciplinary Core Ideas, Cross-Cutting Concepts and standards from other disciplines (e.g., CCSS) aligned to the concepts and practices explored today. Even if time is limited, it is always beneficial to discuss the instructional choices made in designing and implementing today's activity.
- After students have examined all maps, ask groups to summarize—providing supporting evidence—the relationship between precipitation, soils, agriculture, and topography for the entire class. Correct misconceptions as they arise.
- Use this activity to build on concept mapping and systems by asking students to add the new vocabulary and relationships they have learned during the maps activity to their Earth systems concept maps (started in Unit 1) following this procedure:
- Pull out your Earth systems concept map. Identify the Earth's system(s) and interacting parts of the system(s) on the concept map that was used in today's map activity.
- Identify new components of the systems that you learned today and add these to your Earth systems concept map. (Encourage students to include interdisciplinary, e.g., economic, systems if these were included in the mapping activity.)
- Discuss how a change in one system may affect another system. What are additional changes that may affect the system?
- Finally, connect the maps activity to the introductory discussion and the physical characterization of soils that will be done in Unit 3 by again discussing different types of data that interdisciplinary scientists might use to examine the students' researched societal issues:
- Scientists use data from maps for many purposes. How might a geoscientist use this data? How might a biologist use this data? How might an environmental scientist use this data? How might an economist use this data? How might a politician use this data? What other type(s) of data might you use alongside the map data?
Assessment
Informal and Formative
Formative: During the map work time, the instructor should observe students working, using questioning to assist the students in meeting the goals. For question ideas, see example questions in the "mapping patterns" section. The goal is to help students move from looking for patterns on a smaller scale (individual maps) to a larger scale (across multiple maps). The instructor should informally assess students' knowledge and evaluation skills during class discussions. Leave time to address any commonly held misconceptions during the final class discussion.
Alternatively, students could answer questions in their science journals as they work and these could be checked when journals are collected. See more information about science journals under "Show Pedagogic choices" under the "making the module work section on the overview of the module.
References and Resources
Source for topographic maps
- TopoCreator allows you to create free, downloadable maps and also has maps for purchase.
- Many other sources (both free and for purchase) are available for topographic and shaded relief maps.
Source for agriculture statistics (maps, data, etc.)
- Search your state department of agriculture website for maps and data banks of agricultural, crop, and livestock production.
Sources for precipitation maps
- State precipitation maps from the PRISM Climate Group; maps show averages from the most recent three decades. Historical precipitation maps are also available.
- State and regional precipitation maps (averages from 1961 to 1990) from the Oregon Climate Service.
Source for soils maps
- USA Soil Survey map is a very general map that will allow you to see a large region.
- The Web Soil Survey from the United States Department of Agriculture (USDA) Natural Resources Conservation Service (NRCS) allows you to zoom in to a smaller region to see localized, high-resolution soils maps.
- The Twelve Orders of Soil Taxonomy from the USDA Natural Resources Conservation Service is a useful reference to accompany the maps.
General soil maps are available through GISonline. The following website has been created to allow anyone in the country to access base topographic maps of their region, superimpose satellite imagery as a layer, and then add the underlying soils to that map image. These maps are all printable. The procedure is as follows:
- Enter the following URL: http://bit.ly/18eURsA and create a public account.
- Zoom in on the area on which you would like to concentrate.
- Go to Base map and add a layer – i.e., Topographic or Imagery or other.
- Go to Add and click search for layers – select US Soil Survey, click add to map from pop-up window.
- Click details and select the labels icon to get a legend. This legend is for the soils orders present from any location.
- You may wish to experiment with the site and add new layers and modify the existing layers.