Constructing a topographic profile
Practice problems
Below you will find some sample problems from the geosciences using steps on the
constructing a topographic profile page.
Problem 1:In Northern California, Lassen Peak forms the centerpiece of Lassen Volcanic National Park (LVNP) - an area of active volcanism that makes up the southernmost volcanic center of the Cascades (volcanoes associated with subduction of the Juan de Fuca plate beneath North America). Besides Lassen Peak, there are lots of other smaller volcanoes scattered around LVNP. One rather interesting one is called Cinder Cone and is a very typical of the smaller volcano type called a cinder cone (hence the name). It has relatively steep sides and a crater at the top. To see the typical profile of a cinder cone, construct a topographic profile along the line A-A' in the map below:

A portion of Redding, CA 7.5' quad
![[creative commons]](/images/creativecommons_16.png)
Provenance: Jennifer Wenner, University of Wisconsin-Oshkosh
Reuse: This item is offered under a Creative Commons Attribution-NonCommercial-ShareAlike license http://creativecommons.org/licenses/by-nc-sa/3.0/ You may reuse this item for non-commercial purposes as long as you provide attribution and offer any derivative works under a similar license.
You may wish to download a
worksheet with the map and profile (Acrobat (PDF) 2.7MB Jul18 11) to complete this exercise with your pen and paper.
- Sketch in the line on the map or locate the line that is provided.
On the map above, the line is marked A-A' and is indicated in RED on the image above.
- Place the edge of a blank piece of paper (or the graph provided) along the line and mark the starting and ending points of the line (label them with A and A', or whatever the given line is labeled).
For this profile, we've used the profile line provided and lined it up with the profile line on the map. Any blank piece of paper will do but sometimes it's just easier to use the graph paper. Since you have a profile provided (you may have to separate it from the map), we've lined up the bottom of the graph paper with the profile line and marked each end with A and A'.

Worksheet with map and profile
Provenance: Jennifer Wenner, University of Wisconsin-Oshkosh
Reuse: This item is offered under a Creative Commons Attribution-NonCommercial-ShareAlike license http://creativecommons.org/licenses/by-nc-sa/3.0/ You may reuse this item for non-commercial purposes as long as you provide attribution and offer any derivative works under a similar license.
- Start at one end (maybe it's the A end) and move along the edge of the paper, making a mark on the paper every time a contour line touches the edge of the paper. Make sure you label each mark with the right elevation so that you can transfer that point to the correct elevation on your profile. (If you get tired of marking every elevation contour, you can just label the index (darker) contours and the places where a contour line repeats). You may also want to mark where rivers or streams occur.
Now that we have the paper lined up, all we have to do is make a mark and label it everytime we see a contour line cross the profile line. The image below has all of the contour lines marked with black tick marks (only a few of the contour lines are labeled).

Profile marked
Provenance: Jennifer Wenner, University of Wisconsin-Oshkosh
Reuse: This item is offered under a Creative Commons Attribution-NonCommercial-ShareAlike license http://creativecommons.org/licenses/by-nc-sa/3.0/ You may reuse this item for non-commercial purposes as long as you provide attribution and offer any derivative works under a similar license.
you can click on the image to make it bigger so you can see what we've done).
- Take note of the highest and lowest elevation you record for later.
The highest marked elevation recorded on the profile is 6800 ft and the lowest is 6320 ft.
- If you have not been provided with a graph for this problem, you need to do the following: When you have marked all of the points where a contour line crosses the paper/profile line, get a piece of graph paper (or a paper with all horizontal lines). Make sure that the graph paper is at least as long as your profile line (you can paste more than one piece together but make sure you line up the grid lines). Draw a horizontal line on the graph paper that is the length of your profile line (label it with A-A' or whatever the line on your plot is labeled). Draw vertical lines above your starting and ending points (these are the y-axes).
You've been given an appropriate plot for your profile, so you can skip this step.
- Label the y-axis (vertical lines) with elevations making sure that your scale goes from highest to lowest on your cross-section (see step 3). For example, if your lowest elevation is 4200 feet and your highest elevation is 7600 feet, you might want to label your axis going from 4000 to 8000 feet.
In step 4, we determined the 6800 is the highest elevation and 6320 is the lowest. The contour interval is 40 ft and your handout indicates that you should try to make the vertical exaggeration 2x. Given the scale, each line would work to be about 40 ft. So start at an appropriate elevation (6280 for the bottom) and make sure you go high enough (>6800). This is what your scale should look like (click for a larger image).

Profile marked with y axis labeled
Provenance: Jennifer Wenner, University of Wisconsin-Oshkosh
Reuse: This item is offered under a Creative Commons Attribution-NonCommercial-ShareAlike license http://creativecommons.org/licenses/by-nc-sa/3.0/ You may reuse this item for non-commercial purposes as long as you provide attribution and offer any derivative works under a similar license.
- Line up your tick marked paper with the bottom of the graph and, beginning with the elevation on the left hand side of the paper, go directly up from that tic mark to make a small dot at the corresponding elevation.
Now that we have appropriate elevations, we can transfer our elevations to the appropriate place on the plot. For example, the first elevation from left to right is 6560 feet - on the appropriate elevation line above your tick mark for 6560 feet, place a dot. Then 6600 feet, and so on. (If you need a reminder of how to plot points, visit the
plotting points page but don't forget to come back and finish this module!!) The finished product should look like this (if it's too small here, click on the picture for a larger version):

dots cindercone
Provenance: Jennifer Wenner, University of Wisconsin-Oshkosh
Reuse: This item is offered under a Creative Commons Attribution-NonCommercial-ShareAlike license http://creativecommons.org/licenses/by-nc-sa/3.0/ You may reuse this item for non-commercial purposes as long as you provide attribution and offer any derivative works under a similar license.
- Once you have transferred all of your tick marks to your graph, connect the dots with a smooth curve.
Remember that anywhere that the same contour repeats on a profile, the landscape must either go up or down a little bit (but not as far as the next contour). Here's the profile connected from the dots plotted in step 7:

Profile smooth cindercone
Provenance: Jennifer Wenner, University of Wisconsin-Oshkosh
Reuse: This item is offered under a Creative Commons Attribution-NonCommercial-ShareAlike license http://creativecommons.org/licenses/by-nc-sa/3.0/ You may reuse this item for non-commercial purposes as long as you provide attribution and offer any derivative works under a similar license.
Note that there is a large crater in the center of cinder cone just as we predicted at the beginning of this question.
Problem 2:
One type of profile that helps geologists visualize topographic data and to understand the topography of rivers is called a longitudinal profile. A longitudinal profile allows you to visualize the changing gradient along a river's length. A longitudinal profile is a graph of a river's elevation versus its length. In the Grand Canyon (in Arizona) there are many side canyons with a variety of longitudinal profiles. Let's look at the longitudinal profile of the stream that drains Garces Terrace on the map below. The contour interval on this map is 50 feet. You can download a '
PDF version of this exercise for practice (Acrobat (PDF) 1.1MB Apr10 19).

Provenance: Jennifer Wenner, University of Wisconsin-Oshkosh
Reuse: This item is offered under a Creative Commons Attribution-NonCommercial-ShareAlike license http://creativecommons.org/licenses/by-nc-sa/3.0/ You may reuse this item for non-commercial purposes as long as you provide attribution and offer any derivative works under a similar license.
- Locate the river on the map that is provided.
On the map below, the
river is marked in blue.

Provenance: Jennifer Wenner, University of Wisconsin-Oshkosh
Reuse: This item is offered under a Creative Commons Attribution-NonCommercial-ShareAlike license http://creativecommons.org/licenses/by-nc-sa/3.0/ You may reuse this item for non-commercial purposes as long as you provide attribution and offer any derivative works under a similar license.
- Place the edge of a blank piece of paper (or the graph provided) along the line and mark the starting and ending points of the line (label them with A and A', or whatever the given line is labeled).
For this profile, we're going to approximate the longitudinal profile with a straight line next to the river. You can also use a string which is then stretched out but because the river is relatively straight, we'll use the edge of a paper. Since you have a profile provided (you may have to separate it from the map), we've lined up the bottom of the graph paper with the edge of the river.

Provenance: Jennifer Wenner, University of Wisconsin-Oshkosh
Reuse: This item is offered under a Creative Commons Attribution-NonCommercial-ShareAlike license http://creativecommons.org/licenses/by-nc-sa/3.0/ You may reuse this item for non-commercial purposes as long as you provide attribution and offer any derivative works under a similar license.
- Start at one end and move along the edge of the paper, making a mark on the paper every time a contour line touches the edge of the paper. Make sure you label each mark with the right elevation so that you can transfer that point to the correct elevation on your profile. (If you get tired of marking every elevation contour, you can just label the index (darker) contours and the places where a contour line repeats).
Now that we have the paper lined up, all we have to do is make a mark and label it every time we see a contour line cross the profile line. The image below has all of the contour lines marked with black tick marks (only a few of the contour lines are labeled).

Provenance: Jennifer Wenner, University of Wisconsin-Oshkosh
Reuse: This item is offered under a Creative Commons Attribution-NonCommercial-ShareAlike license http://creativecommons.org/licenses/by-nc-sa/3.0/ You may reuse this item for non-commercial purposes as long as you provide attribution and offer any derivative works under a similar license.
you can click on the image to make it bigger so you can see what we've done).
- Take note of the highest and lowest elevation you record for later.
The highest marked elevation recorded on the profile is 1300 ft and the lowest is 650 ft.
- If you have not been provided with a graph for this problem, you need to do the following: When you have marked all of the points where a contour line crosses the paper/profile line, get a piece of graph paper (or a paper with all horizontal lines). Make sure that the graph paper is at least as long as your profile line (you can paste more than one piece together but make sure you line up the grid lines). Draw a horizontal line on the graph paper that is the length of your profile line (label it with A-A' or whatever the line on your plot is labeled). Draw vertical lines above your starting and ending points (these are the y-axes).
We've provided a section of graph paper on the attached PDF with no labels but sized so that you can detach it and draw the profile.
- Label the y-axis (vertical lines) with elevations making sure that your scale goes from highest to lowest on your cross-section (see step 3). For example, if your lowest elevation is 4200 feet and your highest elevation is 7600 feet, you might want to label your axis going from 4000 to 8000 feet.
In step 4, we determined the 1300 is the highest elevation and 650 is the lowest. The contour interval is 50 ft and given the scale, each line would work to be about 50 ft. So start at an appropriate elevation (650 for the bottom) and make sure you go high enough (>1300). This is what your scale should look like (click for a larger image).

graph for river profile
Provenance: Jennifer Wenner, University of Wisconsin-Oshkosh
Reuse: This item is offered under a Creative Commons Attribution-NonCommercial-ShareAlike license http://creativecommons.org/licenses/by-nc-sa/3.0/ You may reuse this item for non-commercial purposes as long as you provide attribution and offer any derivative works under a similar license.
- Line up your tick marked paper with the bottom of the graph and, beginning with the elevation on the left hand side of the paper, go directly up from that tic mark to make a small dot at the corresponding elevation.
Now that we have appropriate elevations, we can transfer our elevations to the appropriate place on the plot. For example, the first elevation from left to right is 650 feet - on the appropriate elevation line above your tick mark for 650 feet, place a dot. Then 700 feet, and so on. (If you need a reminder of how to plot points, visit the
plotting points page but don't forget to come back and finish this module!!) The finished product should look like this (if it's too small here, click on the picture for a larger version):

elevations for river profile
Provenance: Jennifer Wenner, University of Wisconsin-Oshkosh
Reuse: This item is offered under a Creative Commons Attribution-NonCommercial-ShareAlike license http://creativecommons.org/licenses/by-nc-sa/3.0/ You may reuse this item for non-commercial purposes as long as you provide attribution and offer any derivative works under a similar license.
- Once you have transferred all of your tick marks to your graph, connect the dots with a smooth curve.
Remember that anywhere that the same contour repeats on a profile, the landscape must either go up or down a little bit (but not as far as the next contour). Here's the profile connected from the dots plotted in step 7:
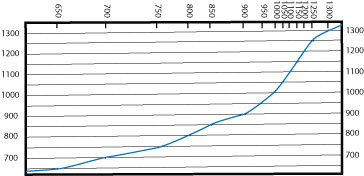
completed river profile
Provenance: Jennifer Wenner, University of Wisconsin-Oshkosh
Reuse: This item is offered under a Creative Commons Attribution-NonCommercial-ShareAlike license http://creativecommons.org/licenses/by-nc-sa/3.0/ You may reuse this item for non-commercial purposes as long as you provide attribution and offer any derivative works under a similar license.
Now you can see where the stream is steep and where it flattens out.
Next Steps
Okay, I am ready to try the assessment. Take me there!. When you get there, remember to log in with your username and your password.