
ConcepTest: Tropic of Cancer Temperature and Precipitation
Question:
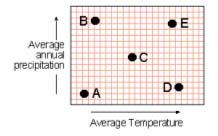
Which of the points on the graph below best represents conditions along the Tropic of Cancer (23 degrees N latitude)?
a. A
b. B
c. C
d. D
e. E
a. A
b. B
c. C
d. D
e. E
Student Responses:
The correct response is E.
Percentage of students choosing this answer. (%Before Discussion/%After Discussion)
a. (2%/2%)
b. (9%/3%)
c. (28%/26%)
d. (13%/8%)
e. (48%/61%)
in a large (60+ student) Earth Science class.
If you would like to help acquire more Before and After statistics for this example, please contact the authors (see link at top of page).