Week 3: Eyes on the Ice
ImageJ Stacks
What is a stack?
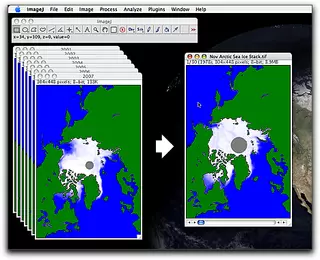
ImageJ can display two or more images in a single window, as a stack. The images or layers that make up a stack are called slices. Stack windows have a scroll bar across the bottom to cycle through the slices, and you can animate the images at a speeds from one frame every 10 seconds to over 1000 frames per second. Many operations, such as selecting, filtering, thresholding, and contrast enhancement can be applied to all slices in a stack.
To stack a set of images, they must all be the same width, height, and bit depth. The number and size of the images you can stack depend on the amount of memory in your computer.
What are stacks used for?
Stacks are used to display and analyze images that are related to each other in some way, such as by time (temporal), space (spatial), or color (spectral). Stacking temporal images allows you to animate them - to rapidly display them in sequence - making changes over time easier to see and understand, and allowing you to precisely measure the same regions of the image over time. Stacks of spatial data can be animated and measured, but you can also use ImageJ to construct entirely new views of features in the images. Using spectral data, you can use ImageJ to create both natural and false color views of a scene.
The Lake Mead satellite images that you stacked and animated in Week 2 are an example of a time series data set. They represent data collected for the same region but at different times. Stacking these images helped you to visualize changes in the lake over time and to make measurements. An advantage of stacking images to make measurements is that when you select an area to measure on one slice of the stack, that selection automatically applies to all slices in the stack. This guarantees that you are measuring the exact same part of the image in every slice. Also, processes such as thresholding apply to all of the slices of the stack.
Stacks can be saved in several formats, including animated gif for web display and, with the appropriate software installed, QuickTime movie format.


