
Part 4—Compare Average JJA Temperatures for both Model Runs
Step 1 – Compare Average JJA Temperatures for both Model Runs
- Return to ArcMap, close any open attribute tables.
- Currently your Layer list should have eight layers. Remove the monthly temperature layers (June, July and August, leaving just the JJA for the 20th Century Experiment and A2 Scenarios).
- Change the symbology to 20-year average for both scenarios. Use an appropriate temperature color ramp of your choosing. Change the max sample size to 33,000. Classify > Sampling > Max Sample Size: 33,000


Step 2 – Add a Continental Outline to the Map
- It can be helpful to add a continental outline layer to your map. Download the following shapefile and add it to your project file.
Country Shapefile (Zip Archive 351kB Jun4 10)
Step 3 – Compare the Temperature Maps
- Visually compare the layers, looking for areas of temperature increase or decrease from the JJA Average of 1980-1999 to 2021-2040.
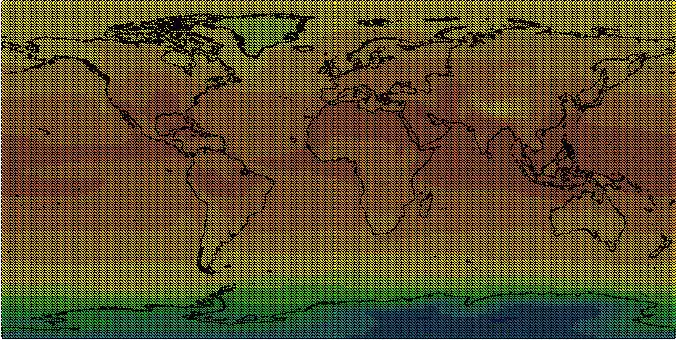
- The comparison maps between the June, July, August Averages of 1980-1999 and 2021-2040 are displayed below. When making a visual comparison of these two temperature maps, it can be difficult to identify areas of subtle temperature changes of even a few degrees. Look carefully at the area around Western Africa in the two maps and notice how the orange area has expanded. Click on each of the maps for a larger image that also has truer color.
Also, notice that the current temperature layers, as downloaded from the NCAR GIS Climate Change Portal, are point shapefiles. If you were to zoom-in on either layer with ArcMap, you would notice the point nature of these layers. In the last part of this chapter, you will create an anomaly map to show the change between the two maps, pictured below.The numbers in this map legend are in degrees Kelvin.
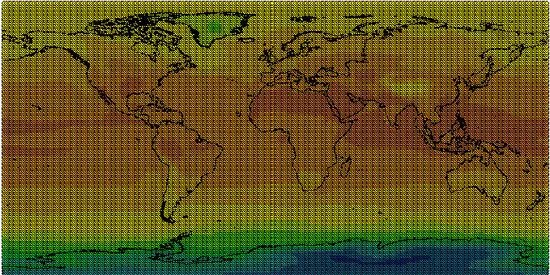
tas_JJA_1980_1999_20th_Century_Experiment map.

tas_JJA_2021_2040_Scenario_A2 map.


If you had difficulty completing the steps above, download the following folder containing the completed project file with data at the end of Part 4. NCAR Climate Change Part 4 complete (Zip Archive 21.2MB Feb3 09)
