Educators may be unfamiliar with some of the more advanced concepts discussed in the climate modules. In the segments below, you will find short introductions to these concepts as well as links to further information and resources.
Weather vs. Climate
×
Provenance: our changing planet Reuse: This item is offered under a Creative Commons Attribution-NonCommercial-ShareAlike license http://creativecommons.org/licenses/by-nc-sa/3.0/ You may reuse this item for non-commercial purposes as long as you provide attribution and offer any derivative works under a similar license.
In a nutshell, the difference between weather and climate is time scale.
Weather is the set of short-term conditions that exist in the atmosphere over periods of minutes, hours, or days, or possibly across weeks. Weather includes atmospheric conditions such as air temperature, precipitation, wind speed, humidity, and fog.
Climate, on the other hand, is a statistic: it is defined by the average weather for a date and location across much longer time scales. How long? Organizations such as the National Climatic Data Center (NCDC) define climate statistically by averaging the previous 30 years of weather, but longer time periods can also be used.
Climate can be defined at whatever spatial scale is relevant: if you are thinking about where to locate a garden, you may select a patch of ground along the south side of your house because the "micro-climate" there is generally warmer than elsewhere on your property. If you were planning to move to a new city, you would be more interested in the climate for the region in which the city exists. Likewise, climate can be defined for a country, a section of a continent, or even for the globe.
One folksy way of describing the difference between weather and climate is found in the saying: "Climate is what you expect; weather is what you get."
The trees and plants that are native to a location are those that have adapted to, and that depend on its climate, even if they can endure the daily or weekly fluctuations of weather that are associated with that climate.
In the graph below the light green band indicates the long-term temperature averages for each day in May. For example, averaging the lowest temperature for May 15 across the previous 30 years of weather results in 54 degrees F, and averaging the highest temperature for May 15 across the previous 30 years of weather results in 75 degrees F. That range between 54 and 75 is indicated by the light green bar above May 15.
The graph also shows us that several days in May, 2014 (beginning and middle of the month) were colder than the average of the past 30 years, but most days in May were warmer than the 30-year average.
The pink and violet represent the highest and lowest temperature ever recorded for each date in May.
×
Provenance: NOAA graphic Reuse: This item is in the public domain and maybe reused freely without restriction.
Natural Climate Variability vs. Climate Change
Like weather vs. climate, the biggest difference between climate variability and climate change is timescale. Climate does vary on scales of years to decades, for instance in the event of an El Niño year, the climate may warm for that one year, and then settle back to a more "normal" pattern the next year. While a true change is more "permanent" or entrenched. Climate change has a definite directional trend.
Natural Climate Variability is defined as changes in local or regional climate that may persist across periods of weeks, months, years, or even a couple of decades, but that do not exceed the 30-year time period across which climate is normally measured. These departures from the normal climate result from temporary changes in the natural system such as ocean currents, jet stream location, fluxes in solar radiation and other large scale fluctuations in phenomena that determine climate. Many of these changes are periodic and have been given names such as El Niño, La Niña, and the Arctic Oscillation. To view graphs of how these events change over time, view the Global Climate Dashboard.
Climate Change is usually defined by change that persist for longer than a 30-year time period. Climate change has historically had natural causes, such as cyclical changes in the shape of Earth's orbit, the tilt of Earth's axis, and the orientation of Earth's axis, all of which influence the amount of solar energy that is absorbed by Earth. For more information about these orbital changes, see the next section, Natural Climate Change and the Milankovitch Cycles. These long-term changes result in the gradual development or retreating of glacial periods, or warming periods during which Earth is free of ice. Scientists have identified periods of global warming and cooling across millions of years of Earth history using evidence from ice cores and from sediment cores extracted from below the world's oceans. There is now abundant evidence that humans are causing a change in the planet's climate by dramatically increasing the amount of carbon dioxide in the atmosphere. (For further information see Intergovernmental Panel on Climate Change Reports or one of the other reports listed in the Keeping Up to Date... section of this introduction.)
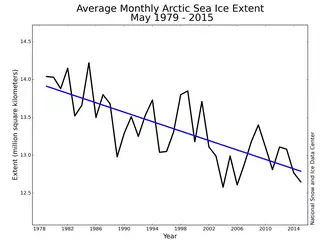
Here is one example of change vs. variability. The graph below shows the average extent of the Arctic sea ice (in millions of square kilometers) for the month of May for every year between 1979 and 2015. The fluctuations of the black line indicate changes in the extent of sea ice that are short term in nature and may be due to natural climate variability or other causes. However, there is no question about the long-term trend: the peaks are lower with the passage of time, and so are the low points. The long-term trend for the extent of Arctic sea ice in May is down, and is an indicator of climate change.
×
Graph showing the arctic sea ice extent for May, between 1979 and 2015
Provenance: Graph created by National Snow and Ice Data Center Reuse: This image was created by the National Snow and Ice Data Center and may be reused with attribution.
Considering All the Data
Selecting specific bits of data to support a particular viewpoint is not uncommon. People often do that when arguing a point of view. To understand what is actually happening, in order to make effective decisions, it's important to take into account all of the data available. Consider the three graphs below. The first shows all of the data regarding the average extent of Arctic sea ice for the month of May between 1979 and 2015. The second graph highlights just two years of data from the 37 year long history—1990 and 2009—and the third graph suggests that average sea ice extent for May is increasing. While it is true that sea ice extent in May 2009 was greater than that in May of 1990, it is obvious how misleading it can be to not consider all of the data. Note: Click on images for a larger view.
×
Graph showing the arctic sea ice extent for May, between 1979 and 2015
Provenance: Graph created by National Snow and Ice Data Center Reuse: This image was created by the National Snow and Ice Data Center and may be reused with attribution.
×
Provenance: Betsy Youngman, none Reuse: This item is offered under a Creative Commons Attribution-NonCommercial-ShareAlike license http://creativecommons.org/licenses/by-nc-sa/3.0/ You may reuse this item for non-commercial purposes as long as you provide attribution and offer any derivative works under a similar license.
×
Provenance: Based on a graph created by the National Snow and Ice Data Center and modified by TERC. Reuse: This item is offered under a Creative Commons Attribution-NonCommercial-ShareAlike license http://creativecommons.org/licenses/by-nc-sa/3.0/ You may reuse this item for non-commercial purposes as long as you provide attribution and offer any derivative works under a similar license.
For several other examples of how data can be segmented and used to support false arguments view this page: Skeptical Science
Natural Climate Change and the Milankovitch Cycles
We know that Earth's climate has been highly variable over time, but what processes are behind these climatic swings?
Serbian astrophysicist Milutin Milankovitch is credited for developing one of the most significant theories relating changes in Earth's orbit to long-term changes in climate, including ice ages. Milankovitch's theory is based on cyclical variations in three aspects of Earth's orbit that result in changes to the seasonality and location of solar radiation reaching Earth. The three aspects are:
Changes in the obliquity (tilt) of Earth's axis
Variations in the shape of Earth's orbit (eccentricity)
Changes in the obliquity (tilt) of Earth's axis
Earth is slightly tilted—that's why we have seasons. As Earth orbits the sun, one hemisphere will be tilted toward the sun for a period of time (summer) and tilted away from the sun six months later (winter). Today, Earth's rotational axis is tilted at about 23.5 degrees from vertical. However, this tilt oscillates between 22.1 and 24.5 degrees on a 41,000-year cycle. Variations in the obliquity (tilt) of Earth's rotational axis result in changes in the severity of seasonal changes. When the tilt is larger, the extremes between summer and winter temperatures are greatest. When the tilt is smaller, the average temperature difference between winter and summer is less drastic. It is believed that it's actually these periods of smaller tilt that promote the growth of ice sheets. When Earth's axis is less tilted, winters are relatively warmer and summers are relatively cooler. This means that there is more moisture in the air in winter and therefore more snowfall. It also means that there is less summer melting, so more of the winter snow accumulation will last through the warmer months.
Variations in the shape of Earth's orbit (eccentricity)
The gravitational pull of other planets orbiting the sun causes the shape of Earth's orbit to be elliptical rather than perfectly circular. Eccentricity (e), which ranges from 0 to 1, is a measure of how much an ellipse deviates from a perfect circle (how flattened the circle is). An orbit with an eccentricity of 0 is perfectly circular, and an orbit with an eccentricity of 1.0 is a parabola (no longer a closed orbit). The shape of Earth's orbit ranges from nearly circular (e = 0.005) to slightly elliptical (e = 0.058) and back again about every 100,000-400,000 years. Changes in eccentricity are important to determining periods of glaciation because they determine the distance between the Earth and sun, and therefore how much radiation is received at the Earth's surface during different seasons. When the orbit is nearly circular, the distance between the Earth and sun (and therefore the amount of solar energy reaching Earth) remains relatively constant throughout the year. However, when the orbit is more elliptical, the distance between the Earth and sun (and the amount of energy reaching Earth) fluctuates between seasons, resulting in slightly warmer or cooler temperatures. Today, Earth's orbit has an eccentricity of 0.017.
Changes in Earth's "Wobble" (Precession)
Earth's axis of rotation behaves like a spinning top that is slowing down, wobbling in a circle over time. Earth's axis wobbles between pointing at Polaris (what we now call the North Star) and pointing at the star Vega (which would then be considered to be the North Star). Every year, this wobble causes Earth to travel slightly farther than one full orbit each year. This means that on today's date next year, Earth will be a little bit further in its orbit than it is right now. This is called precession. Earth's axis completes a full cycle of precession approximately once every 26,000 years. Because Earth's orbit isn't perfectly circular, the distance between the Earth and sun (and the average temperature) will be slightly different each year on the same date. Precession can cause significant changes in climate due to greater contrast in seasons. For example, when Earth's axis is pointed at Vega, the winter solstice in the northern hemisphere coincides with Earth being at its farthest distance from the sun (aphelion), and the summer solstice coincides with Earth being at its closest distance from the sun (perihelion). Just like with variations in obliquity and eccentricity, the more drastic seasons brought on by precession will impact glaciation.
Greenhouse Gases, Electromagnetic Radiation, and Climate
Every object that has a temperature above absolute zero (-273 C or -459 F) emits electromagnetic radiation. Really hot objects emit more of the shorter, higher energy wavelengths (such as visible light, ultraviolet light, x-rays, and gamma rays) and cooler objects emit more of the longer, lower energy wavelengths (such as infrared radiation, microwaves, and radio waves). If you heat up a metal rod it will first emit or radiate the longer wavelengths, such as infrared radiation, which we can sense as heat but that is not visible to our eyes. Heat up that rod enough and it will start to glow because it is emitting shorter wavelength radiation (visible light) that our eyes can detect, in addition to the infrared radiation that we can feel but not see.
×
electromagnetic spectrum
Provenance: NASA Reuse: This item is in the public domain and maybe reused freely without restriction.
The Sun is hot enough to radiate mostly high energy, shorter wavelength radiation (mostly visible light) although it also radiates wavelengths across most of the electromagnetic spectrum. The high energy visible light passes through Earth's atmosphere largely without interacting with it, and when that solar energy reaches Earth much of it is absorbed by and warms Earth's surface.
Although Earth is warmed by the Sun, its temperature is low enough that it radiates only long wave, lower energy radiation (infrared radiation). In contrast to the radiation coming from the Sun, that long wave infrared radiation does get absorbed by and warm some of the gases in the atmosphere, the so-called greenhouse gases. Those greenhouse gases (carbon dioxide, methane, water vapor, ozone, nitrous oxide) make up only a tiny fraction of Earth's atmosphere, which is mostly nitrogen and oxygen, but once those greenhouse gases are warmed--which means the molecules move more rapidly--they not only re-radiate that energy, they also collide with and transfer their energy to the non-greenhouse gases, thereby warming all of the gases in atmosphere. That warmed atmosphere radiates its energy in all directions. Some is radiated up and is lost to space, but some is radiated back toward Earth. In fact, the amount of energy that Earth's atmosphere radiates back toward Earth is greater than the amount of energy Earth receives directly from the sun. Without greenhouse gases Earth would radiate most of its heat directly back to space and would have an average temperature of about -19 C (-2.2 F) vs. the present average of about 15 C (59 F).
Eventually the atmosphere releases its energy, but the process of slowing down its escape back into space has a significant impact on Earth's temperature.
More Details
What is the difference between oxygen or nitrogen, which together make up close to 99% of the atmosphere, and a greenhouse gas? The main difference is geometry, or the structure of the molecules. Watching this amusing video, featuring Dr. Scott Denning from Colorado State University, will give you more details about how atmospheric gases have different capacities for absorbing radiation.
Climate and Feedback Loops
Throughout the EarthLabs modules you'll find references to the Earth system, the interconnected set of sub-systems or spheres (atmosphere, hydrosphere, biosphere, geosphere, cryosphere) that exchange energy and matter and that interact to form our planet's environment. Some examples of these interactions are: 1) volcanic eruptions move matter and energy from the geosphere into the atmosphere and the hydrosphere; 2) decaying plants and animals (biosphere) result in chemical changes to the atmosphere and to the geosphere. The resource Earth System: The Basics(Acrobat (PDF) 134kB Jun23 22) provides a simple overview of this very complex Earth system with its interacting elements.
The two examples above are simple and correct, but they are also incomplete. Often changes in one sphere of the Earth system continue to trigger changes in other spheres in a "falling dominos" fashion, and those sequential changes can circle or loop back around to influence the process that started the change. Such loops are called feedback loops. These feedback loops are one of the key features that lead scientists to describe the Earth system as a "complex system". One of the goals of the EarthLabs Climate modules is to introduce students to the concept of the complex system.
There are two basic types of feedback loops: one type works to moderate or balance an initial process, and the other type tends to amplify or reinforce the initial process. In a nutshell, each time you circle around a balancing feedback loop, the effect reverses itself, tending toward equilibrium, and each time you circle around a reinforcing feedback loop, the effect remains the same, tending toward change. Here are examples of each type.
Balancing Feedback Loop*
×
Diagram of a balancing feedback loop that included evaporation, atmospheric water vapor, cloud cover, and albedo.
Provenance: Nick Haddad, TERC Reuse: This item is offered under a Creative Commons Attribution-NonCommercial-ShareAlike license http://creativecommons.org/licenses/by-nc-sa/3.0/ You may reuse this item for non-commercial purposes as long as you provide attribution and offer any derivative works under a similar license.
The driver of the loop, which is the driver for most Earth system processes, is solar energy. Solar energy is absorbed by Earth, which warms it and causes evaporation.
Loop #1
Evaporation
Leads to increased water in the atmosphere
Leads to increased cloud cover
Leads to increased Albedo (reflection of solar energy into space by clouds or other reflective surfaces)
Increased albedo (less solar energy absorbed by Earth) leads to:
Loop #2
Decreased evaporation
Leads to decreased water in the atmosphere
Leads to decreased cloud cover
Leads to decreased Albedo (reflection of solar energy off clouds)
Decreased albedo (more solar energy absorbed by Earth) leads to:
Loop #3
Increased evaporation
Leads to increased water in the atmosphere
Leads to increased cloud cover
Leads to increased Albedo (reflection of solar energy off clouds)
This reversal between increased evaporation and decreased evaporation happens with every loop and defines the Balancing Feedback Loop. Balancing feedback loops act to maintain the stability of the planet.
Reinforcing Feedback Loop*
×
Diagram of a reinforcing feedback loop that includes evaporation, atmospheric water vapor, greenhouse effect, and atmospheric temperature
Provenance: Nick Haddad, TERC Reuse: This item is offered under a Creative Commons Attribution-NonCommercial-ShareAlike license http://creativecommons.org/licenses/by-nc-sa/3.0/ You may reuse this item for non-commercial purposes as long as you provide attribution and offer any derivative works under a similar license.
Again, the driver of this loop is solar energy. Water vapor, which is a known "greenhouse gas", acts to help Earth retain heat in the atmosphere that would otherwise radiate directly into space. (It is the lack of this greenhouse gas in the atmosphere above deserts that leads to such dramatic cooling of deserts once the sun sets.)
Loop #1
Evaporation
Leads to increased water in the atmosphere
Leads to increased greenhouse effect
Leads to increased atmospheric temperature
Increased atmospheric temperature leads to:
Loop #2
Increased evaporation
Leads to increased water in the atmosphere
Leads to increased greenhouse effect
Leads to increased atmospheric temperature
Increased atmospheric temperature leads to:
Loop #3
Increased evaporation
Leads to increased water in the atmosphere
Leads to increased greenhouse effect
Leads to increased atmospheric temperature
This constant reinforcing of a trend happens with every loop and defines the Reinforcing Feedback Loop. Reinforcing feedback loops act to change the equilibrium of the planet.
The Complex Earth System
Solar energy constantly drives a vast number of feedback loops, both balancing and reinforcing, in the Earth system, making that system incredibly complex. It is beyond the scope of the Climate Earthlabs modules to untangle the many competing balancing and reinforcing feedback loops and look for a net result. The only purpose is to make you and your students aware of these two basic types of feedback loops and to look for and recognize them as they appear in the Climate EarthLabs modules.
* The terms "balancing feedback loop" and "reinforcing feedback loop" were proposed by Dr. Kim Kastens in her blog Going Negative on "Negative" Feedback, which appears in Earth and Mind: The Blog. The examples of the two types of feedback loops were also drawn from Dr. Kastens' blog post.
The common name used for "balancing feedback loops" is "negative feedback loops", and the common name for "reinforcing feedback loops" is "positive feedback loops". We agree with Dr. Kastens that those common names can lead to confusion since the terms positive and negative commonly refer to "good" and "bad" and can incorrectly suggest that the feedback loops have good or bad effects.
Anomaly Maps and Graphs
×
temperature anomaly map
Provenance: NOAA Reuse: This item is in the public domain and maybe reused freely without restriction.
Anomaly Maps and Graphs don't show actual measurements for weather variables. Instead they show the difference, or anomaly, between a recent average and the long-term average for a selected period of time, referred to as a base period. These types of maps and graphs help us to see change in an absolute value. In other words, they allow us to answer the question: how much above or below average are the given values?
Anomaly maps most often use dot size or a color gradient to represent the difference between a given period and the base period. That base period is typically 30 years on maps. Notice that in the anomaly map, shown right, most places on Earth had a warmer average temperature in 2011 than they had during the 1971-2000 base period. In this example map, the temperature anomalies (difference from average) in 2011 were greatest in northern Asia.
Interactive maps of climate, including temperature and precipitation anomalies, for the United States can be viewed online at Climate at a Glance.
Below is a different type of anomaly map, one that uses shades of color instead of dot sizes to indicate the magnitude of the departure from the long-term average. The base period for this NOAA map is more recent. It compares the November, 2012 average temperatures for the U.S. against the average of all 30 of the Novembers between 1981-2010.
×
temperature anomaly map-us-2011
Provenance: NOAA Reuse: This item is in the public domain and maybe reused freely without restriction.
Anomaly graphs sometimes use a longer base period than the maps. In the example below, the base period is the 100-year period 1901-2000. The average global temperature for the base period is used as the zero line on the graph. Notice in the graph below that long term trends, such as the 1880-1910 cooling period or the 1910-present warming period often have shorter-term temperature reversals embedded within them. These irregularities highlight the fact that the factors that combine to create Earth's climate are numerous and varied; their interactions are complex, and they can cause short-term reversals during longer-term trends that are being driven by persistent factors.
×
temperature anomaly graph
Provenance: NOAA Reuse: This item is in the public domain and maybe reused freely without restriction.


![[creative commons]](/images/creativecommons_16.png)


![[reuse info]](/images/information_16.png)


