ConcepTest: EQ Distribution, North America
 This material was originally created for
Starting Point:Introductory Geology
This material was originally created for
Starting Point:Introductory Geology and is replicated here as part of the SERC Pedagogic Service.
Question:
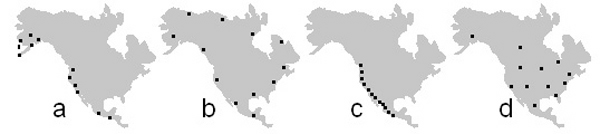
Which of the maps below best represents the distribution of magnitude 6 or greater earthquakes in North America within a decade?
a.b.
c.
d.
Student Responses:
No data yet. The correct response is A.
If you would like to help acquire more Before and After statistics for this example, please contact the authors (see link at top of page).